Creating pay-per-click (PPC) ads is one of the most effective ways to grow your business in today’s digital landscape. But before you launch campaigns, the first step is choosing the right platform. Most advertisers start by comparing Microsoft Ads vs Google Ads to decide where their audience is most active and where their budget will have the greatest impact.
In the United States, the two major PPC platforms are Google Ads and Microsoft Ads (formerly Bing Ads). Picking the wrong one can lead to wasted spend, low-quality traffic, or underperforming campaigns. This guide breaks down the key differences and similarities to help you make the right choice—or determine whether running both is best.
Microsoft Ads vs Google Ads: 10 Key Differences and Similarities
While the two platforms look similar on the surface, they operate differently in ways that can affect performance, targeting, cost, and strategy.
Platform Reach
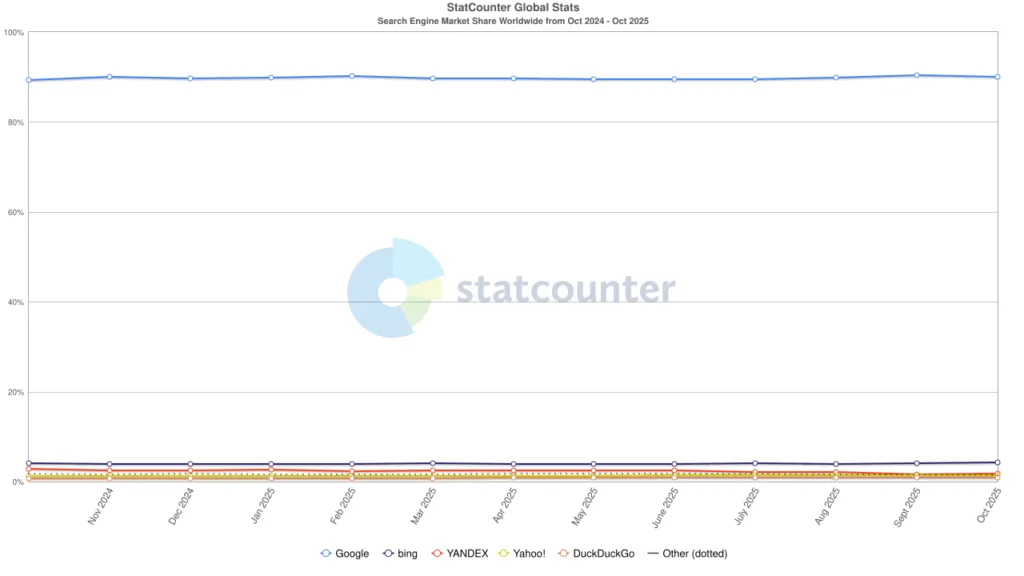
When choosing a PPC platform, reach is one of the first things to consider.
Google holds roughly 90% of the U.S. search market, making it the dominant search engine. Microsoft Ads captures around 7%, which still represents over 44 million searches—an audience you may miss if you rely on Google alone.
The demographics differ too:
Bing/Microsoft Ads Users:
Older
More likely married
Higher incomes
More education
Google Ads Users:
Younger
Tech-comfortable
More likely in white-collar roles
Grew up using Google as a default
Google’s reach expands further through the Google Search Network (Maps, Shopping, Google Play) and the Google Display Network (over 2 million sites).
After identifying where your audience searches, the next factor is cost.
Google Ads typically has 242% higher CPCsthan Microsoft Ads due to stronger competition and more advertisers. Interestingly, retail advertisers sometimes pay more on Microsoft Ads than Google Ads, depending on niche competitiveness.
Audience Targeting
Both platforms offer excellent audience targeting options for all advertisers. However, when deciding between Microsoft Ads vs Google Ads for your business, it’s important to remember your audience targeting strategy. If you create a well-crafted ad but don’t show it to the right people at the right time, it will lead to wasted ad spend.
With Google Ads, you have two options for reaching your ideal audience. These are content and audience targeting.
With content targeting you can on the display networks where you want your ads to show or not show. This includes targeting topics, placements, or content keywords.
With Google Ads audience targeting you can target segments or groups of people with specific interests, intents, and demographic information.
Google Ads audience targeting is broken down into the following segment types:
Affinity Segments
Custom Segments
Detailed Demographics
Life Events
In-Market
Your Data Segments
Microsoft Ads offer a very similar targeting for your audiences with one distinct difference, LinkedIn Targeting.
With Microsoft Ads you can target and reach customers via:
Custom Audiences
Customer Match
Device Targeting
Dynamic Remarketing
In-Market Audiences
LinkedIn Targeting
Location Targeting
Remarketing
Similar Audiences
Strategizing within audience segments can make or break your PPC advertising no matter which platform you use. Ultimately we think Google Ads audiences beat out Microsoft Ads due to the vast information available collected with Google’s sophisticated audience gathering.
Both platforms offer strong targeting, but Google’s depth is unmatched due to its massive data ecosystem.
Google generally wins in audience quality because of its broader data collection, while Microsoft wins for B2B targeting thanks to LinkedIn.
Ad Formats
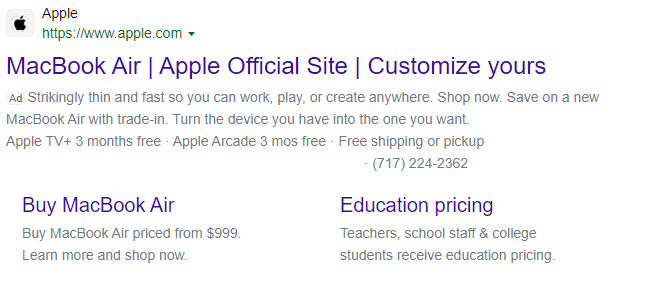
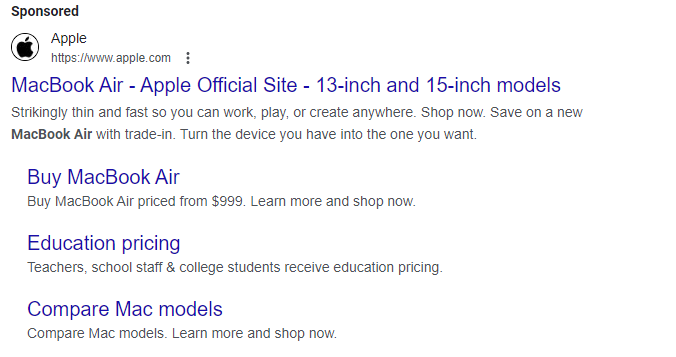
Example of MacBook Air search ad through Microsoft Ads on BingExample of MacBook Air search ad through Google Ads on Google
Deciding between Microsoft Ads vs Google Ads often depends on what you want to accomplish with the ads themselves. Both platforms offer a variety of different ad types to help you reach your customers where they are.
Both platforms offer:
Responsive Search Ads
Display & Native Ads
Shopping Ads
App Install Ads
Video Ads
Call-Only Ads
Most notably is the responsive search ads in both platforms. These are most likely the first ads you will create.
These operate in almost an identical fashion. In Google Ads or Microsoft Ads, you need to provide up to 15 headlines and four descriptions which the ad systems will mix and match the ideal combination of headlines and descriptions to match the user being targeted.
Both platforms are constantly updating ad format types to entice users to use their platforms.
Microsoft Ads has been expanding its platform with exclusive partnerships including Netflix Ads which makes them more competitive with Google Ads.
Google Ads has been adding new campaign types to combine the various ad formats including Demand Gen and Performance Max.
Both platforms offer nearly identical ad formats, including:
Responsive Search Ads
Display and Native Ads
Shopping Ads
Video Ads
App Install Ads
Call-Only Ads
Responsive search ads function the same on both: up to 15 headlines and 4 descriptions mixed in real time to find the best performer.
Microsoft is expanding through partnerships like Netflix Ads with it’s premium streaming ads, while Google continues to innovate with Demand Gen and Performance Max.
Keyword Match Types
Keyword match types are the same across both platforms:
With the same landing pages and the same ads, Google typically produces an 81% higher key event rate, thanks to stronger machine learning and user signal quality.
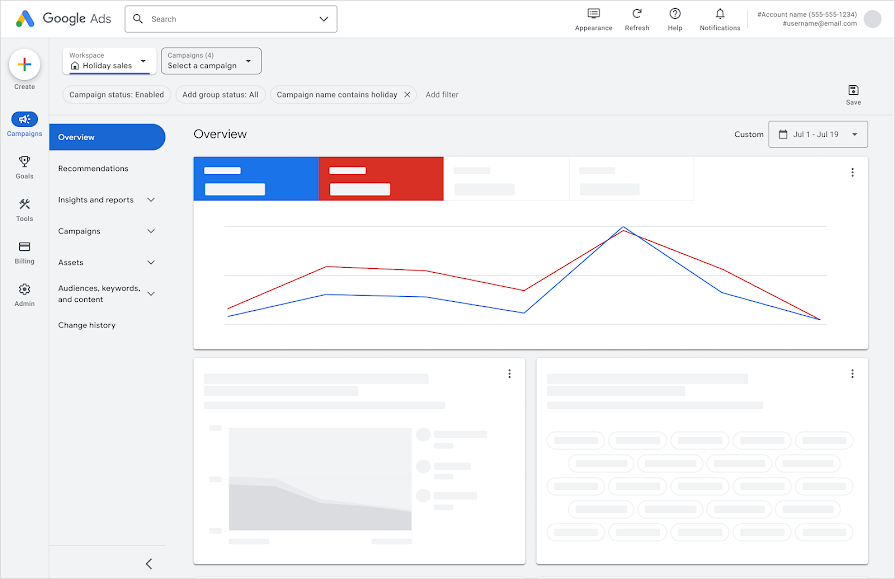
UX Designs
Microsoft Ads intentionally mirrors Google Ads so advertisers can switch or import campaigns without learning a new system. You can import a Google Ads account into Microsoft Ads and replicate the structure almost exactly.
Google’s interface generally feels more polished, but Microsoft’s familiarity makes onboarding simple.
Free Tools & Resources
Both platforms offer:
Keyword planners
Tracking tools
Shared libraries
Bulk actions
Basic setup assistants
However, Google stands out due to its seamless connection to Google Analytics and other Google products.
Microsoft uses its own Universal Event Tracking (UET) tag, but you can easily install it through Google Tag Manager.
Customer Service
Support experiences differ widely:
Google Ads:
No more instant live chat
Email support, community forums
Occasional outreach from Google reps via emails or phone calls
Microsoft Ads:
Live chat support
Request-a-call options
Generally, it’s easier to reach a real person
For many advertisers, Microsoft support is more accessible.
Conclusion
Choosing between Microsoft Ads vs Google Ads is a major decision for any business starting PPC. Each platform offers unique strengths, from Google’s extensive reach and machine learning capabilities to Microsoft’s strong B2B options and lower costs.
The reality? Most businesses benefit from using both platforms. Running campaigns side-by-side lets you compare performance, expand your reach, and identify which platform gives you stronger returns over time.
If you build a thoughtful PPC strategy across both systems, you’ll see clearer insights, better optimization opportunities, and a more complete picture of your paid search performance.
If you’re struggling on either of the platforms, Tower Marketing’s PPC management experts are equipped to help. Reach out to a team member to schedule a free PPC management consultation.
On July 31, 2019, Google announced a new way to unify both app and website measurement with their new platform Google Analytics 4 or GA4 with the plan to sunset Universal Analytics in the near future.
After the original announcement, there have been many delays in the official plan to sunset Universal Analytics (UA) after backlash from many businesses. But now, there is an official date of July 1, 2023, in which Universal Analytics will stop processing your business’ data.
The switch to GA4 has huge implications if you rely on Google Analytics for measuring your KPIs, but being prepared is the best way to combat the inevitable confusion and questions you have when the switch happens.
Our goal is to help you understand eight of the main differences between Google Analytics 4 vs Universal Analytics so you are prepared to start making those business decisions you rely on.
Main Difference #1: Google Analytics 4 Interface
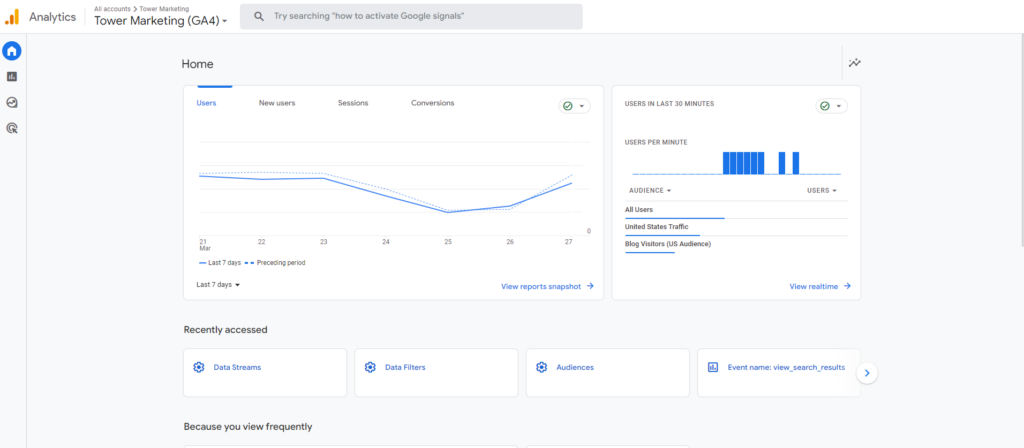
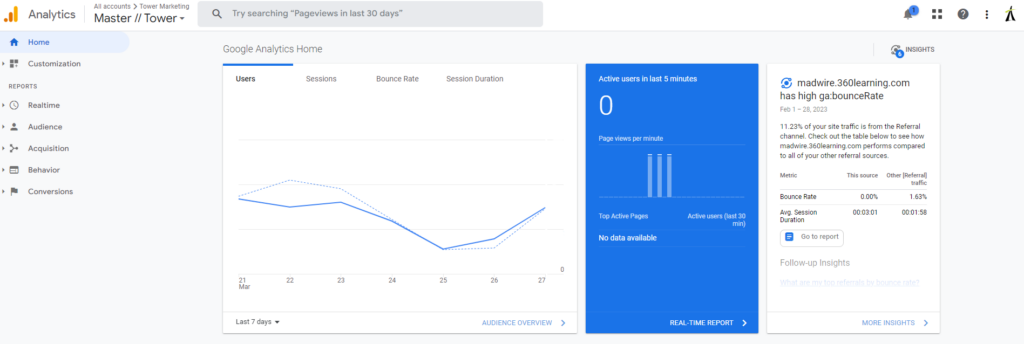
The most striking difference you’ll immediately notice in GA4 is the new interface. The GA4 interface looks very different from UA.
Right off the bat in GA4, you’ll see more data in the home section that’s generated by Google’s “automated insights” feature. These insights are automatically created by Google using its new machine-learning capabilities. They’ll trigger automatically whenever GA4 detects spikes or falls in your data.
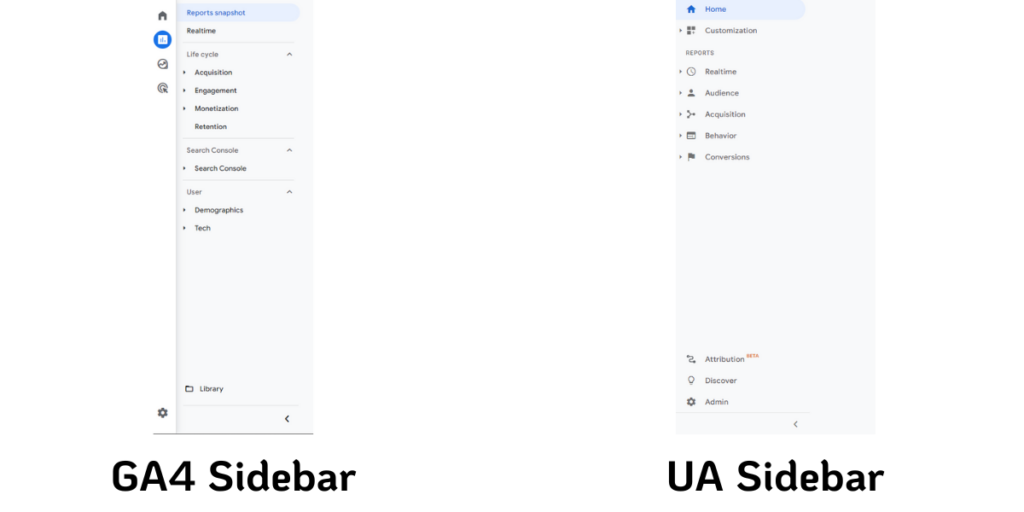
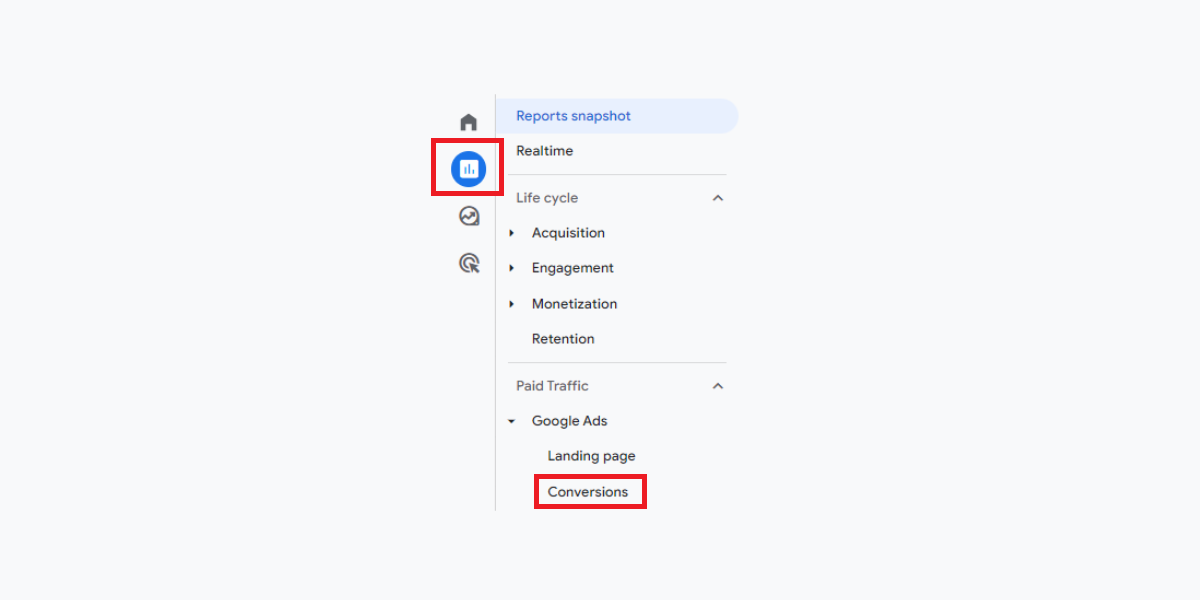
You’ll also notice there are new navigation features. In GA4, you will see on the left-hand side of the property “Home, Reports, Advertising, Exploration, and Configure.” When you compare this to Universal Analytics you will see “Home, Customization, Realtime, Audience, Acquisition, Behavior, and Conversions.”
When comparing Google Analytics 4 vs Universal Analytics, all the navigation options on Universal Analytics are now under “reports” in Google Analytics 4. Under the reports function, you’ll be able to see where your users came from, what valuable actions they took on your site, and much more.
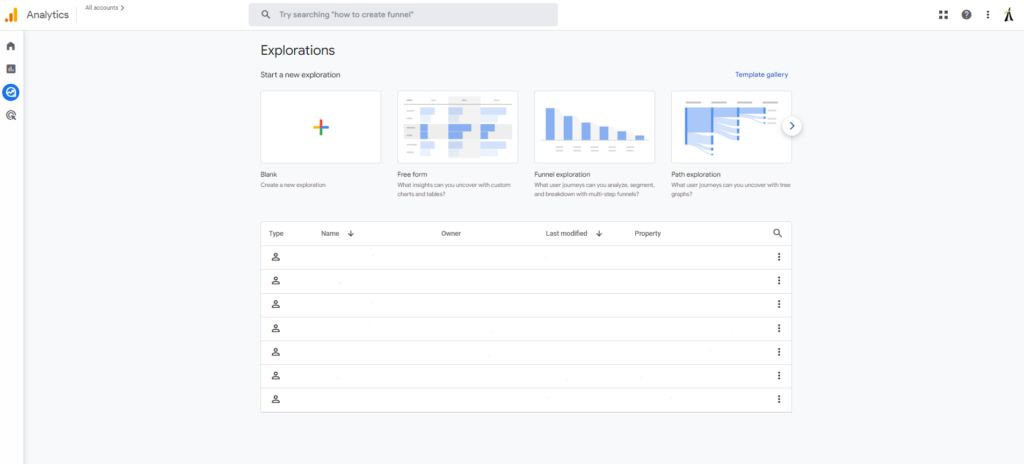
Most importantly, there are two new navigation options “Exploration” and “Advertising” which are brand new to Google Analytics 4.
Exploration Report
Out of all the changes to the platform, the most valuable to businesses is the new Exploration Reports.
With the exploration reports, you will be able to track your key business metrics in much more detail than in UA. These reports allow you to perform custom analysis and gain insights into your app and/or website’s performance.
The Exploration reports provide a variety of visualization options, such as charts, tables, and graphs, to help you understand the data more easily. Additionally, you can use the “Analysis” feature to apply machine learning algorithms to your data and uncover deeper insights.
The Exploration reports are particularly useful for identifying trends, tracking user behavior, and measuring the effectiveness of your marketing campaigns. We suggest learning Google Analytics 4 exploration reports as soon as you understand the basics of the new interface, as it yields the most powerful insights.
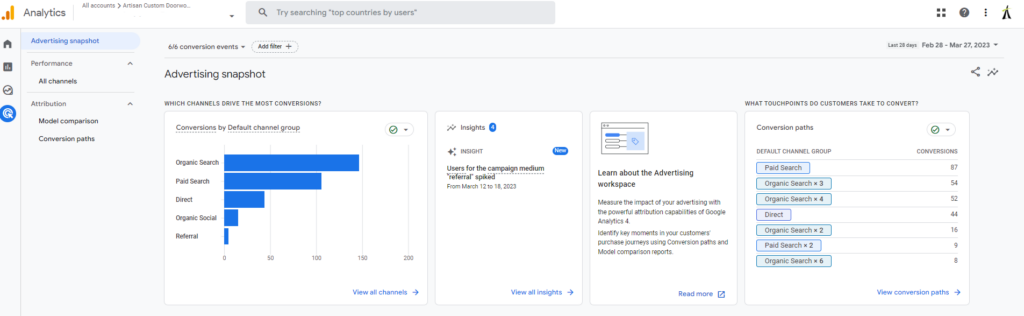
Advertising Report
The Google Analytics 4 advertising report provides insights into your paid media efforts with a focus on attribution modeling.
The GA4 advertising report allows you to track key metrics, such as impressions, clicks, and conversions, and analyze the data by dimensions like ad creative, campaign, or audience. You can also use the reports to monitor the cost and return on investment (ROI) of your advertising campaigns.
Most notably, the “conversion paths” allow you to see your performance across all inbound advertising campaigns including Facebook, LinkedIn, Spotify, Google Ads, and more.
The advertising reports, if you use them properly, will help you optimize your advertising spend, refine your targeting, and improve the effectiveness of your campaigns.
Main Difference #2: Event-Based
Besides the initial interface differences between Google Analytics 4 and Universal Analytics, the next biggest difference is the use of events in GA4.
Every metric in Google Analytics 4 is an event while Universal Analytics is hit-based.
This means when you are analyzing your data in GA4, everything from a page view to a form fill is an event.
While Universal Analytics can record events as well as page views, GA4 provides a more comprehensive view of user behavior and engagement. Comparing this to Universal Analytics, which tracks and measures the number of times a page is viewed by the user.
Main Difference #3: Session Scope
If you are comparing your Google Analytics 4 vs Google Universal metrics, you may notice, they are not the same. Why? There are a couple of different answers, but the most notable is the way GA4 defines sessions.
Firstly, GA4 defines sessions as “when a user opens your app in the foreground or views a page or screen and no sessions are currently active”. Whereas in Universal Analytics, a session is “ a group of user interactions with your website that takes place within a given time frame.”
The main difference between Google Analytics 4 vs Universal Analytics sessions is that GA4 uses sessions as a period of user activity whereas Universal Analytics sessions are a period of time.
Google has also said sessions in your GA4 property may be lower than your Universal Analytics property because “Google Analytics 4 does not create a new session when the campaign source changes mid-session, while Universal Analytics does create a new session under that circumstance.”
Secondly, GA4 sessions are based on events, rather than page views. A session in UA is calculated as the time between the first and last hit. Whereas GA4 is calculated as the time between the first and last event.
Lastly, a single session in GA4 can be across multiple traffic sources where a UA session stops when the original campaign source is stopped.
One last note about sessions in GA4 is the metrics associated with them. Since GA4 is based on events, there are new session metrics within GA4.
These include:
Engaged Sessions
An engaged session in GA4 is a session that spent 10 seconds or more on the site/app or viewed 2 or more screens/pages or had a conversion event.
Engaged Sessions Per User
Engaged sessions per user is the number of engaged sessions divided by the total users on your site and mobile apps.
Main Difference #4: User Scope
Another distinction between Google Analytics 4 and Universal Analytics is the way the users on your site are measured.
In Universal Analytics there are two user metrics: total users and new users. In Google Analytics 4, there are now three user metrics:total users, new users, and active users.
As mentioned above, since everything in GA4 is based on events, the user metrics are also based on events.
These new metrics mean:
Total Users: Number of users who had an event
New Users: Number of users who had an event occur for the first time
Active Users: Number of users that had an engaged session
In Google Analytics 4, the primary metric is active users, whereas in UA it is total users.
Main Difference #5: Pageviews
Google Analytics 4 and Universal Analytics differ in their pageviews measurement methodology, making it difficult to make an accurate one-to-one comparison between the two platforms.
Page views are defined in two specific ways between the two platforms:
Universal Analytics: Total number of pages viewed
GA4: Total number of app screens and/or web pages the user saw
Please note, the metric of unique pageviews which is measured in UA is not measured in GA4.
Main Difference #6: Conversions
When you switch to GA4, you’ll notice a disparity in conversion tracking. GA4 uses an event-based system, meaning that each site conversion is treated as an event, rather than a pageview. This results in each user action on the site being tracked as an event.
With the addition of events, comes more advanced methods of conversion tracking in GA4. Most notably, conversion modeling.
Conversion modeling uses the machine learning capabilities of GA4 to estimate the number of conversions that may have been missed due to data gaps or incomplete data.
The machine learning model uses data from users who did convert on your custom conversions and those who did not convert. This allows you to identify patterns and correlations that may indicate which user behaviors are most likely to learn to convert.
Alongside the conversion modeling comes the addition of cross-device tracking. This means you can track how your users are converting whether they are on your website or on your mobile app. This makes tracking GA4 conversions much easier than Universal Analytics.
A great example of how GA4 has led to more conversions is McDonald’s in the Hong Kong Market. They were able to successfully increase in-app conversions by 550% while utilizing the various machine-learning algorithms in which GA4 operates.
Main Difference #7: Bounce Rate & Engagement Rate
One of the more popular metrics you could gain valuable insights from in Universal Analytics is bounce rate. This is the percentage of sessions that contain a single page view on your website.
However, in GA4 since everything is event-based, the definition changes. The GA4 bounce rate definition is the “percentage of sessions that were not engaged sessions.”
When using Google Analytics 4, it’s preferable to examine the engagement rate rather than bounce rates, which is a significant factor that sets it apart from Universal Analytics.
The engagement rate in GA4 is the percentage of engaged sessions. This can be more helpful than bounce rate as you can analyze and decide which pages have low engagement rates and strategize how to increase the engagement rate on those pages.
Main Difference #8: Filters
In Universal Analytics, it was industry standard to create multiple views within each property. Usually, this was to segment and filter out data that wasn’t valuable to your business.
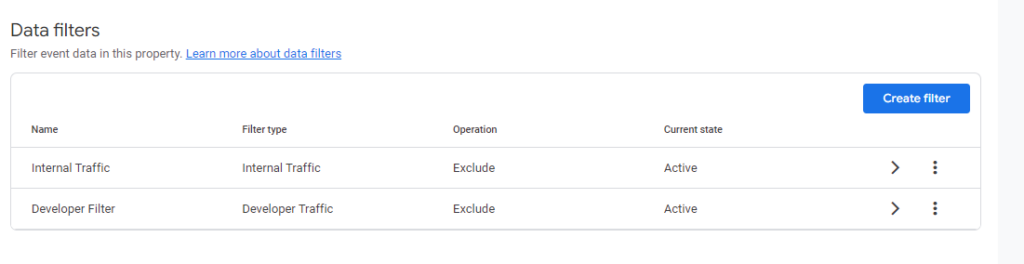
When you migrate to Google Analytics 4, you won’t see the filters you were used to seeing. Instead, you will see only two “data filters” in GA4. These are “developer traffic” and “internal traffic.”
The developer traffic filter is a predefined filter that allows developers to exclude their own traffic from analytics data. These filters are automatically applied to each GA4 property when created. (It’s worth noting that these are not foolproof and may not catch all the testing developers are doing on your site. )
The internal traffic filter in GA4 is a predefined filter that allows website or app owners to exclude traffic from their own organization’s network or devices.
Those are all the filters you can add in GA4. You cannot exclude certain IP addresses, include only your operating country of business, or segment your site’s content.
This means that all traffic in your GA4 right out of the box is similar to an “unfiltered” view in Universal Analytics. This means you can be making assumptions about your data and users that may not even apply to your business.
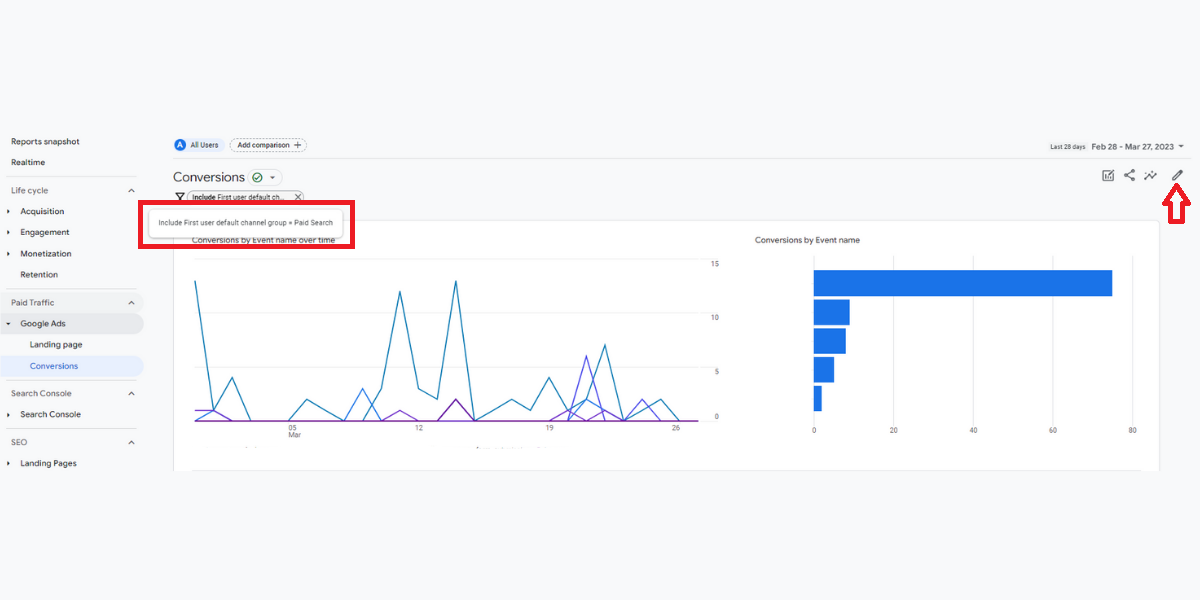
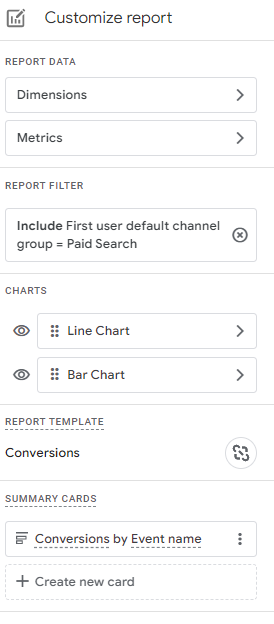
While there are less robust filters in GA4 vs Universal Analytics, there are several ways to “create a view” in GA4. The best way we would recommend to create “views” would be to create custom reports in GA4 using the filters in there.
For instance, if you wanted to look at only United States event conversions, you would create a custom report and add the filter view “County = United States”. You can apply this logic to other segments you wish to view including channel grouping, all events, etc.
These are just eight of the main differences between Google Analytics 4 vs Universal Analytics. There are countless differences between the two platforms, but ultimately, the switch to GA4 will give you a better understanding of the actions a user takes on your website or app.
Interested in improving your marketing efforts through data analysis? Reach out to our team to develop a custom plan that helps you track and meet your business goals.
In part one of our local SEO series, we talked about how your business can reap the many benefits of local SEO by understanding what goes into ranking well. We mentioned one of the most important ranking factors for local SEO was backlinks.
One of the best ways to gain backlinks for your website is to add your business to as many relevant local SEO directories as possible. With a well-thought-out and researched local SEO directory strategy, you can put your business in front of highly targeted users and show up on the most important search engines.
Are Directories Valuable for Local SEO?
Adding your business to some, if not all of the local SEO directory listings below, will add value to your business, including both algorithmic and user benefits.
Generating backlinks for your site through directories can increase your chances of ranking well on search engines. Each backlink, a link that goes from one website to yours, essentially acts as a “point” in the local SEO algorithm regardless of what search engine you are trying to rank on.
Some directories will have higher point values than others due to their domain authority. When your site gains backlinks from directories, you are adding “points” to your site which will be a positive ranking factor that you will see.
Perhaps the most important and valuable part of adding your business to directories is getting your basic information in front of highly-relevant audiences. If you are strategic with your directory submissions, you can send your information to users who are lower down in your marketing funnel.
For instance, if you are a roofing business, you can add your company to local directories like Angi , HomeAdvisor, or Roofing Insights, a specific directory for those looking to get their roof replaced.
Local SEO Directory: Do’s & Don’ts
With all of the factors mentioned above, you can see just how important adding your business to local search directories is. You can boost your online reputation through various review sites, create backlinks to your site, and gain brand awareness. However, there are some do’s and don’ts when adding your site to directories.
Do’s: Be Consistent
Many of the local business indexes share data. That’s why it is important to have the same information displayed on each business listing you create.
At the absolute minimum, all of your local business listings should include the same:
Business name
Address
Phone number
Website address
Short description
These names, addresses, and phone numbers (NAP) must be exactly the same across all the listings you submit to. Additionally, create the same message. Make sure your categories and taglines are similar to avoid confusion.
Local listings all require you to add a business description, and it’s best to provide a long and short version. Adding all this information over and over again is tedious, so create two descriptions of your business:
A short description (about 125 characters)
A longer description (about 300+ characters)
With the descriptions ready, all you have to do now is copy and paste them to each of the local listings below to properly reap the local SEO benefits for your business.
Don’t: Add To Spam Sites
A general rule of thumb when submitting to local SEO directories is to check for spamminess. If a site looks like spam, it probably is. One way is to check a site’s domain authority via Moz. Generally, any site scoring lower than 20 would be considered spam and having links on those sites will add toxic links to your site.
Do: Claim Your Listings
As mentioned above, you may find that you are already listed on many sites, but you need to claim your listing. You may also notice that some of the information is incorrect. Make sure to change that when you claim your business listings.
Don’t: Target Irrelevant Listings
There are thousands of possible directories to add your business to and you may be tempted to add your business to every single one of them. However, targeting irrelevant directories will hurt you. Not only are you deceiving search engines, but you are also providing misleading information to the user that found your site.
Do: Add As Much Information As Possible
In addition, add as much information as possible. The more information you add, such as pictures, logos, and staff photos, the better. You want your listing to stand out from the competition.
In fact, Google Business Profile, recommends adding at least 22 photos to your profile. Tower Marketing recommends getting professional photography done to properly showcase your business.
Don’t: Create Duplicate Listings
There are many reasons why your business might have duplicate listings. Maybe your business moved locations or a previous effort was placed on creating a listing on that particular site.
Whatever the situation is, duplicate listings can confuse users and search engines. As noted above, the key to creating a successful local SEO directory strategy is consistency. If possible, delete the old listings or claim and update them.
Best Online Business Local Directories
Take a couple of hours and add your business website to these top-rated local SEO directories.
While these listings are generally used for any business, we also highly recommend checking out Moz’s Directory Listings page. Here you can find the top industry-specific directories to add to.
If you don’t see your industry there, Tower Marketing’s local SEO team can help you find the best directories for your local SEO strategy.
Top Free Business Listings
Google Business Profile is the one free listing we encourage every business to utilize.
While there are thousands of free business listings online to choose from, these are the ones we would recommend starting with regardless of your industry.
Google Business Profile (GBP) formerly known as Google My Business.
Having a Google Business Profile listing is probably the most important first step when trying to rank in the top local results. All you need to get started is a Gmail account and if you don’t have one, create one. Adding your Google Business Profile listing information here will help you to be found across Google platforms, including organic search results, and the Google Maps Pack.
It should be a top priority for any business to have its location listed on Google Maps. More users are searching for products and services with local intent and using GPS navigation as a way to guide them to different locations. Optimizing your Google Business Profile page will help your business to be found on Google Maps.
Bing Places for Business
This business listing is powered by Bing.com and operates in a similar fashion to the Google My Business listing service. Bing Places for Business is a Bing portal that enables local business owners to add a listing for their business. With Bing Places for Business, once you have your Google Business Profile set up, you can import that information directly onto Bing so you do not have to redo essentially the same work.
Apple Maps
Apple Maps is one of the most used map platforms in the world. Local SEO Guide estimates that at least 75-100 million adults it. With your business listed, users can see directly in the app your reviews, photos & categories just like Google Maps.
Please note that you can submit a business listing for free on Apple Maps but often the information is pulled from other sources such as Yelp.
Yahoo Listing via Yext
Getting a Yahoo Listing isn’t as easy as Bing or Google. In order for you to claim your listing on Yahoo, you have to go through Yext.
These listings are very similar to Bing or Google. Use your same NAP across Yahoo as well.
Please note, you can claim your free listing on Yahoo via Yext but there are also more premium options that allow you to distribute your information across up to 50 platforms.
Facebook
You will need to create a Facebook business page, which means you will first need to have a personal account on Facebook. Add your business name, description, and website, and connect with users socially.
Yelp
Most people think you need to be a restaurant to be listed on Yelp. Not true. Any US business can be added to the local business listings.
Foursquare
Foursquare is a local search and discovery app and is a fantastic business listing to be included. Make use of their location data by adding your business.
Insider Pages
Insider Pages is a web directory looking to offer users the best recommendations. Not only do you want your business listed here, but you also want people who use this site to recommend you.
TripAdvisor
TripAdvisor is great for B2C businesses. This free business listing online allows you to share your hours, upload photos, and more importantly, customers can leave reviews. There’s also a Q&A section where you can answer your most commonly asked customer questions. TripAdvisor profiles can also be shared across other directories online.
Best of the Web (BOTW)
BOTW is a general web directory listing for both commercial and non-commercial sites. Each listing is manually approved and, therefore, search engines value the citation of businesses listed here. This is one of the oldest internet web directories and is organized by category, offering content-rich and well-designed websites.
Superpages
This is a great online that acts much like the Yellow Pages. Superpages is a local business directory including phone numbers, ratings, reviews, maps, driving directions, your address, website, hours of operation, and more.
NextDoor
While NextDoor is often thought of as a social media platform for connecting with your neighbors, it is also a great place to list your business. Here you can share posts with people in your community making it one of the more powerful local SEO directories out there. Your business can even interact with users much like Facebook or Instagram as well.
Citysearch
Citysearch is a web-based city guide offering information about local businesses using categories throughout different states in the US.
HotFrog
HotFrog is a commercial website directory sorting businesses according to location and category.
Yellow Pages
Yellow Pages is one of the most well-known off-site and on-site directories. Everyone has heard of it or used it, at some point. Having your business listed here is a must.
Top Paid Business Listings
The Better Business Bureau is one of the best paid local SEO directories.
Please note, as of the time of this writing, you have to pay to be on each one of these listings. Each platform additionally has multiple pricing levels with the option to pay for advertising as well. We recommend adding costs for the platforms into your marketing budget.
Angi FKA Angi’s List
Angi formerly known as Angi’s List, is one of the most powerful listings you can add to your local SEO directory strategy especially if you deal with homeowners. While Angi is free to join, the most powerful way to use Angi is to pay for lead generation. You can also send and build custom quotes, request payments, and integrate with QuickBooks making it one of the more forward-thinking business directories.
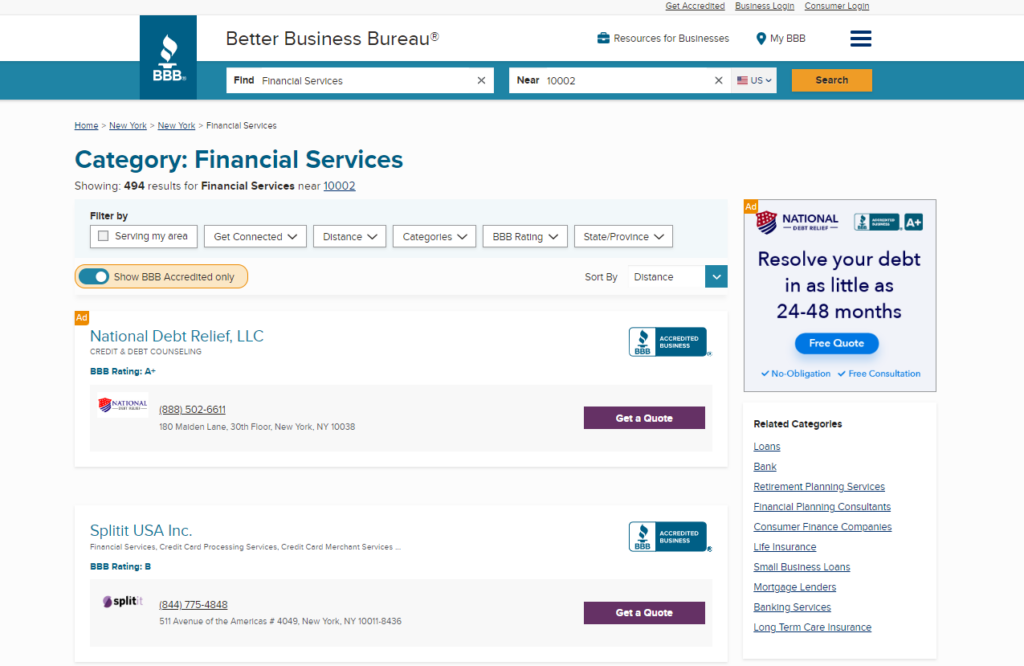
Better Business Bureau AKA BBB
The Better Business Bureau is a nationwide nonprofit organization with a self-described mission of “focusing on advancing marketplace trust”. Once again this is free to join but to become an accredited business in the BBB, that comes with a fee. With the fee, you show customers “that you are an honest, ethical business that they can trust.”
Within their listings, users have the option to search for BBB Accredited Businesses only OR all businesses which includes the free account. In each listing is a list of complaints from consumers, average star rating as well as your NAP.
HomeAdvisor
HomeAdvisor is a great local SEO directory to add your business to if you deal with homeowners. Getting your business on HomeAdvisor is only paid and there are no free options so do careful research before deciding if it’s a good fit.
Chamber of Commerce
Listing your business on your local chamber of commerce website is a great way to reach local customers and network with other businesses. While each chamber of commerce has different pricings, you will most likely not be able to join for free.
Taking the time and effort to add your business to the listings above and to your industry’s niche directories will be worth it. There is both a local SEO algorithm and user value to adding to each website.
We at Tower Marketing have done this for our clients across almost every industry you can think of. We understand it can cost time and money to add to each directory. But we can help you find your industry’s niche directory and even do the hard work for you with our local SEO services.
Our team of experts will help get your business ranking well locally no matter where you conduct business. Contact us today to get our local SEO expertise.
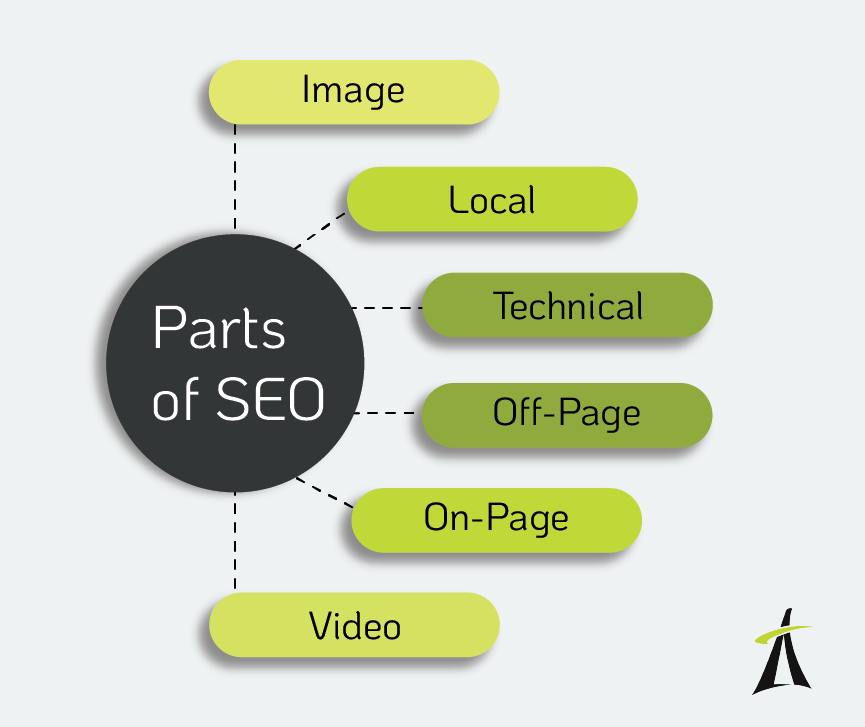
Many factors make up SEO. There is image, on-page, technical, video, and off-page SEO just to name a few. But local SEO is one of the most accessible and valuable subsets of search engine optimization that nearly anyone can pick up.
Throughout this post, you will gain the necessary knowledge it takes to reap the many local SEO benefits for businesses. From understanding what the current local search ranking factors are to directories to add your business to, you’ll be dominating the Google Maps pack in no time (well, maybe in a couple of months as we SEOs like to say.)
Local SEO vs Organic SEO
What is Local SEO?
Local SEO is the practice of improving your business’s visibility in the local results provided by Google, Bing, or Yahoo. Think of Local SEO as your business information in Google Maps, Waze, or on Apple Maps.
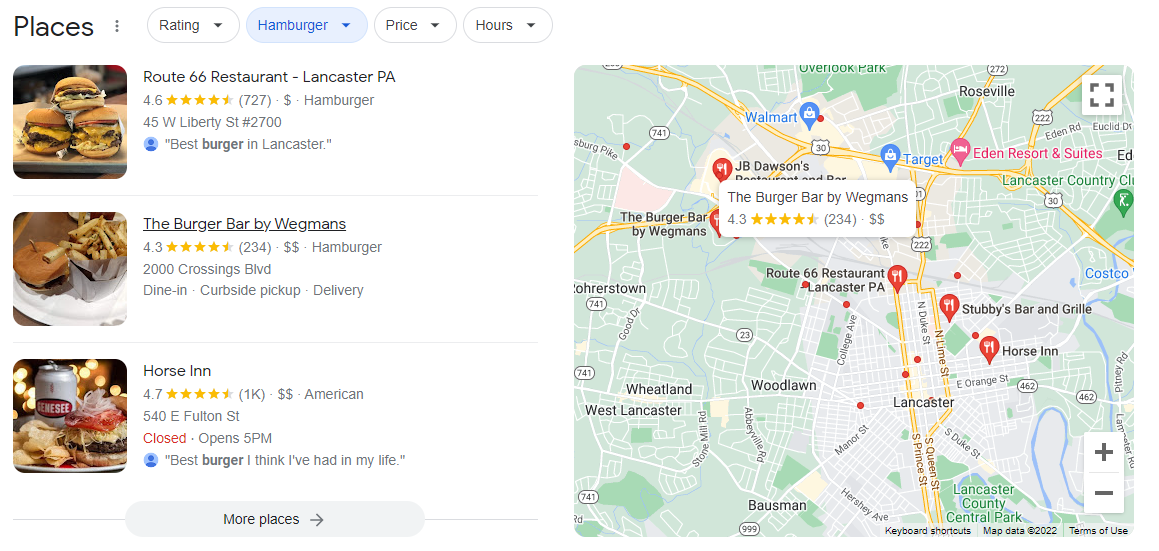
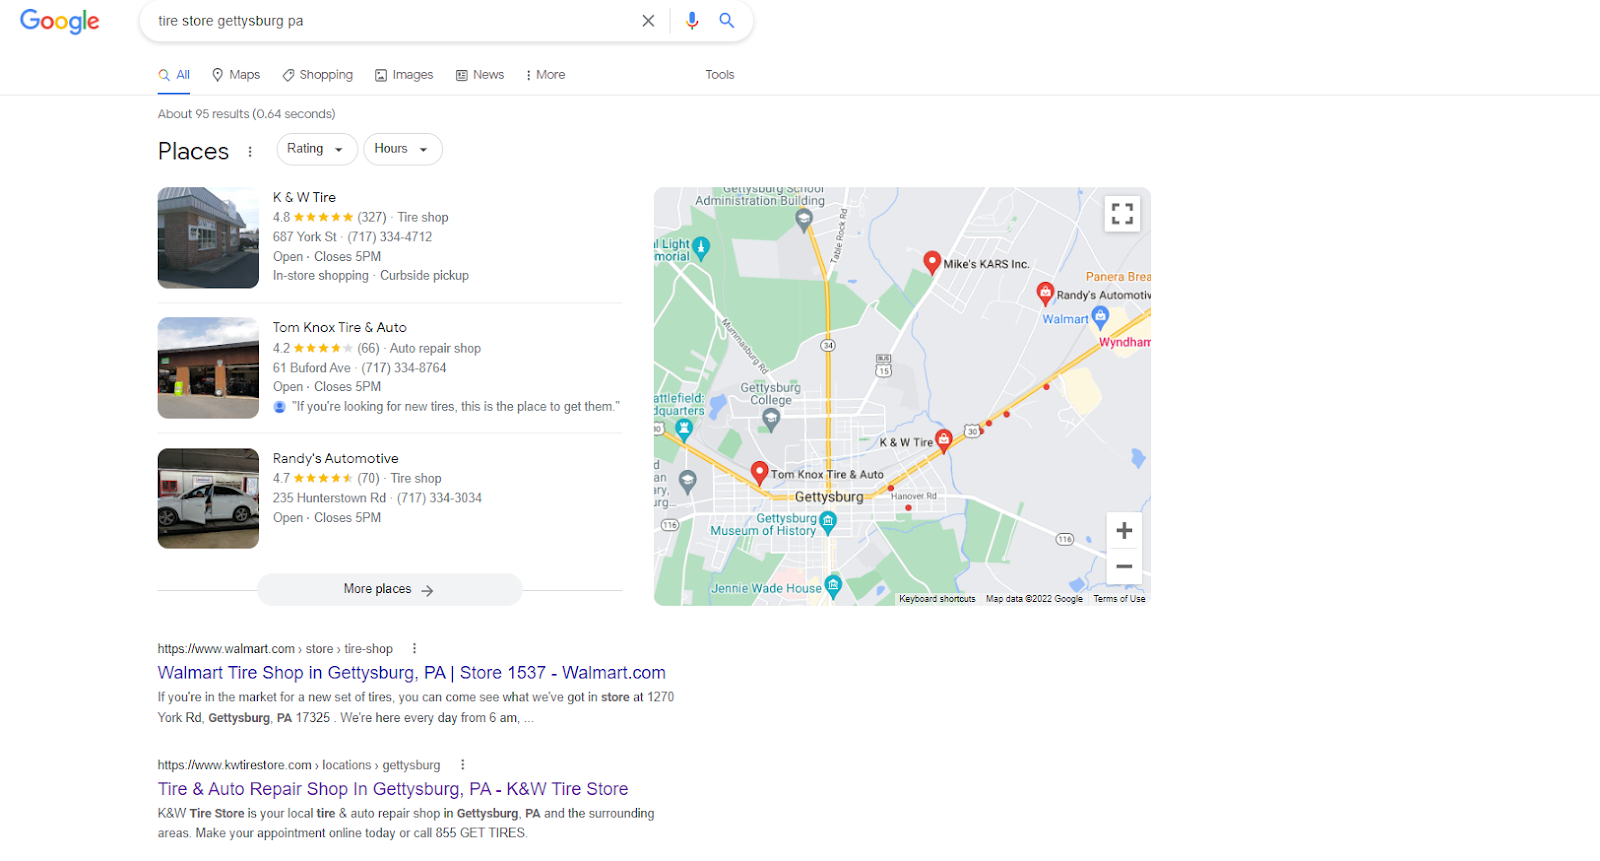
An easier way to think about what local SEO is is to remember the last time you went on Google to look for something you need. Whether it was a “burger near me,” “tree trimmer”, or “bookstores”. When you search those queries, you are browsing and finding the best local business for your needs, and it is Google’s purpose to deliver the best possible answer to your search.
What the Google Map Pack looks like on desktop for “burger near me” in 2022.
What is organic SEO?
Organic SEO is what makes up the rest of your search engine optimizations minus local SEO. This includes making your product and service pages, blogs, etc. more visible on search engines that do not include utilizing the map packs. There are a variety of techniques to boost your company’s page on SERPs or Search Engine Result Pages, many of which we at Tower have covered which you can read here.
Local SEO is just one of the many parts of SEO.
Key Differences Between Local SEO & Organic SEO
While both local SEO and organic SEO fall under the parent category of “search engine optimizations” there are a few key differences between them.
Local SEO focuses on ranking higher in the map packs or on ranking higher for local keywords on your website
Organic SEO focuses on ranking higher in other SERP features such as related questions, or instant answers.
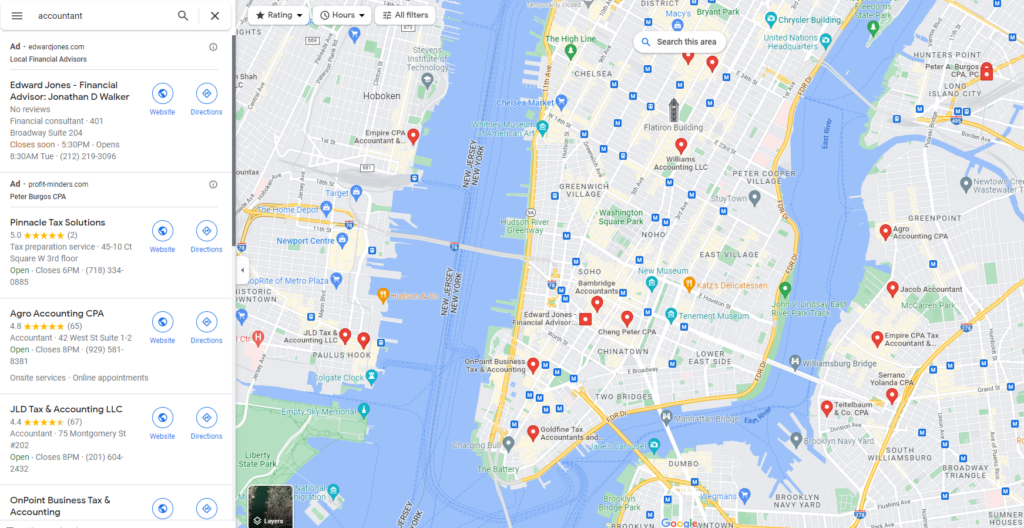
Several years back if you searched for “coffee shops“, top spots would’ve gone to Starbucks, Dunkin’ Donuts, or Seattle’s Best. Now I see results for coffee shops located in Lancaster, PA such as Square One and Passenger. These results are more relevant and are even based on how close they are to my current location.
The real reason why local SEO is so important to local businesses is the ability to compete with national brands. This can be very difficult or impossible to do with organic SEO. Below are two screenshots that show the real importance of local SEO for local businesses.
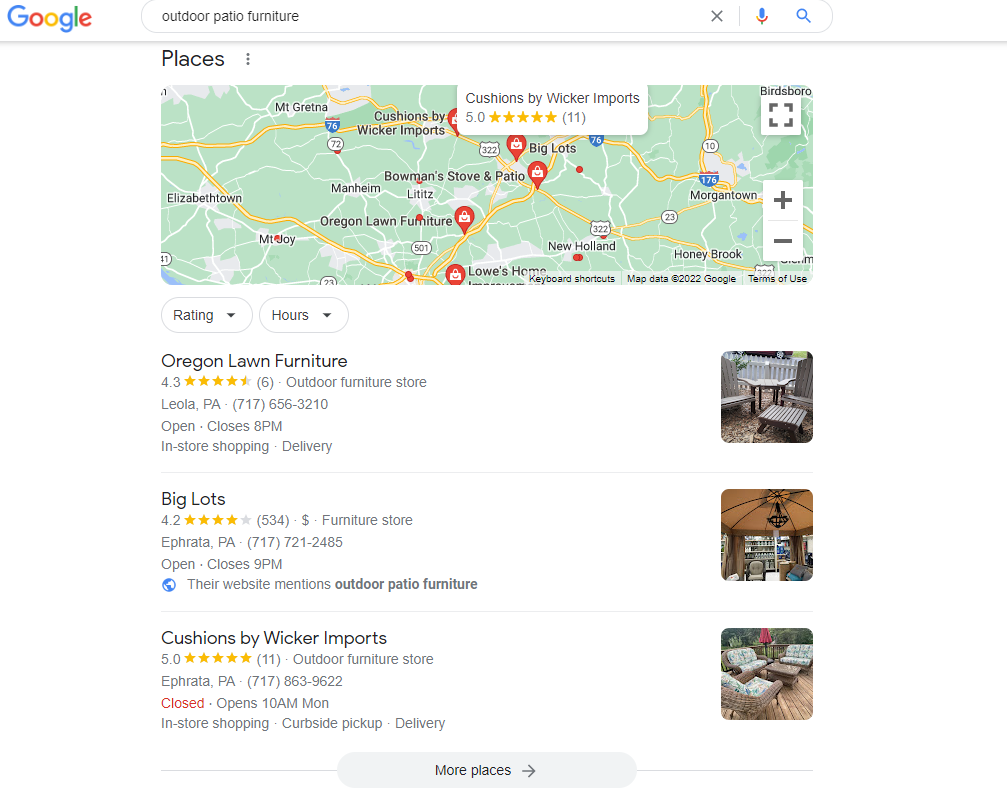
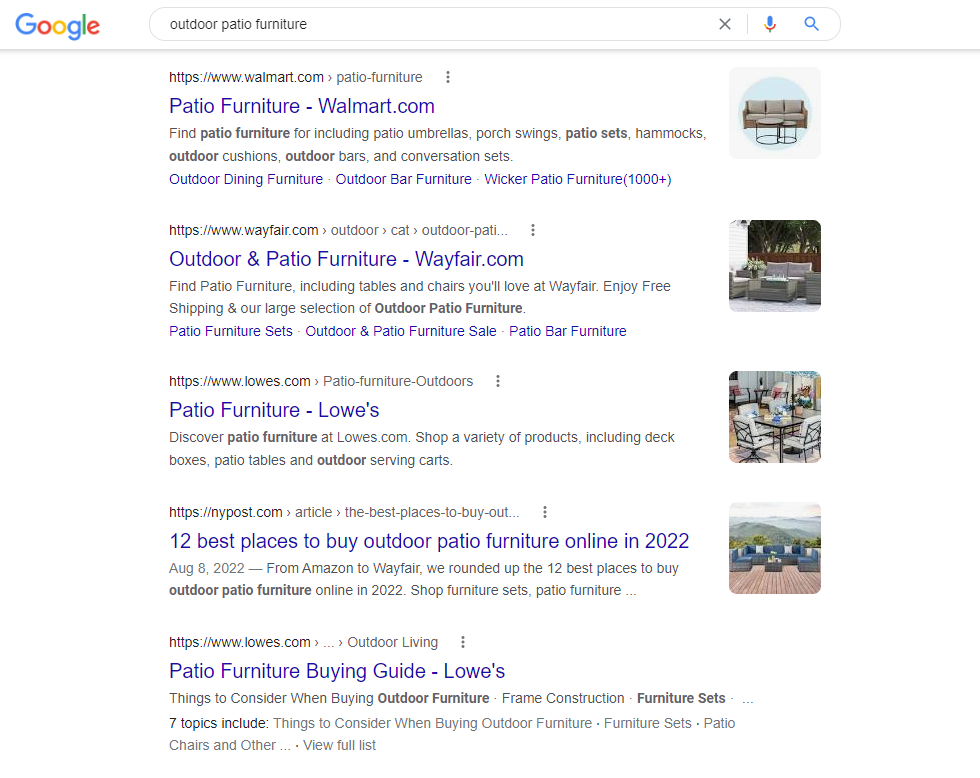
The same SERP for “outdoor patio furniture” shows how your business can benefit from local SEO.
When “outdoor patio furniture” is searched for, local companies are given. These companies would not likely be able to outrank the companies in organic SEO if it wasn’t for their Google Business Profile.
The same search result, in the second screenshot, shows that national businesses are given directly under the local SEO results. Because of local SEO, smaller businesses are able to be placed higher up on the SERP.
Most Important Local Search Ranking Factors 2022 & Beyond
Now that you have a solid understanding of the importance of local SEO, it’s time to dive into the ranking factors that will bring your business even higher up on the local SERPs.
These are the ones that have the highest impact on your local SEO rankings and have been the most consistent throughout the inception of Google My Business which was created in 2005.
#1) Google Business Profile Factors
If there is only one thing your business does for local SEO, we recommend making sure your Google Business Profile, formerly known as Google My Business, is up-to-date with your business information.
Whether you have claimed your profile or not, there are important factors that go into your profile.
Business Name. Make sure this is the same as your business. If it is not, you can potentially be ranking for the wrong name.
Categories. Most importantly, you want to choose a “primary category” for your business. You can then add up to nine supporting categories. It’s important to note that you cannot create your own category, so it’s best to choose a general category if you can’t find one that perfectly suits your company.
There are hundreds of options to choose from when selecting your business categories on your Google Business Profile. The most important one is the “primary category”. You can up to nine supporting subcategories as well.
Google suggests “ Choose a primary category that describes your business as a whole and be specific. When you start to enter your category, choose a category from a dropdown that shows up.
Google also suggests “If the category you want isn’t available, choose a more general category that still accurately describes your business. You can’t create your category.”
Website URL. While this can be technically any page on your site, we recommend having your website URL be your homepage. We also suggest adding UTM codes so you know where the visitors are coming to your site from.
Hours. It is best practice to make sure that when your hours change, you also update your Google Business Profile. Be sure to add in “special hours” too, including holidays, special events, or anything else that you may need to close your store for (weather, electrical problems, etc.).
Service Area. Specifying your service area is very important for your local SEO strategy. You can add up to 20 service areas per profile and these should include any areas your business is capable of delivering to or providing a service for. You may also opt to provide your address so users have a better idea of where your service areas are.
Relevance. Google refers to relevance as “how well a local Business Profile matches what someone is searching for”
Distance. Google defines this as “Distance considers how far each potential search result is from the location term used in a search. If a user doesn’t specify a location in their search, we’ll calculate distance based on what we do know about their location.”
Prominence.
“Prominence refers to how well known a business is. Some places are more prominent in the offline world, and search results try to reflect this in local ranking. For example, famous museums, landmark hotels, or well-known store brands are also likely to be prominent in local search results.”
#2) On-Page Optimizations
While on-page SEO is often associated with organic SEO as mentioned above. Its importance still remains one of the most important local SEO ranking factors you can control on your website.
Homepage Content
Your homepage receives the most views and should be filled with descriptive content to explain what your business offers, your industry, and the audience your serve. Users coming to your site should not question what your business offers.
Text and Context
Is there a useful amount of text on each page? Having enough content on each page is critical in helping your customers understand what your website offers, not only to humans but to search engines, too.
You have a short period to convince the user that they have landed on the right page. It is integral to craft content that is useful, relevant, and that reassures the user they came to the right page, otherwise, they leave your site.
A simple yet very effective way of implementing local SEO is to make sure the city and state of your business are included in the title tags and meta description. Other areas to optimize include the main heading and body of content of each web page.
Can you guess the Tower Marketing local SEO client?
#3) Local Business Schema
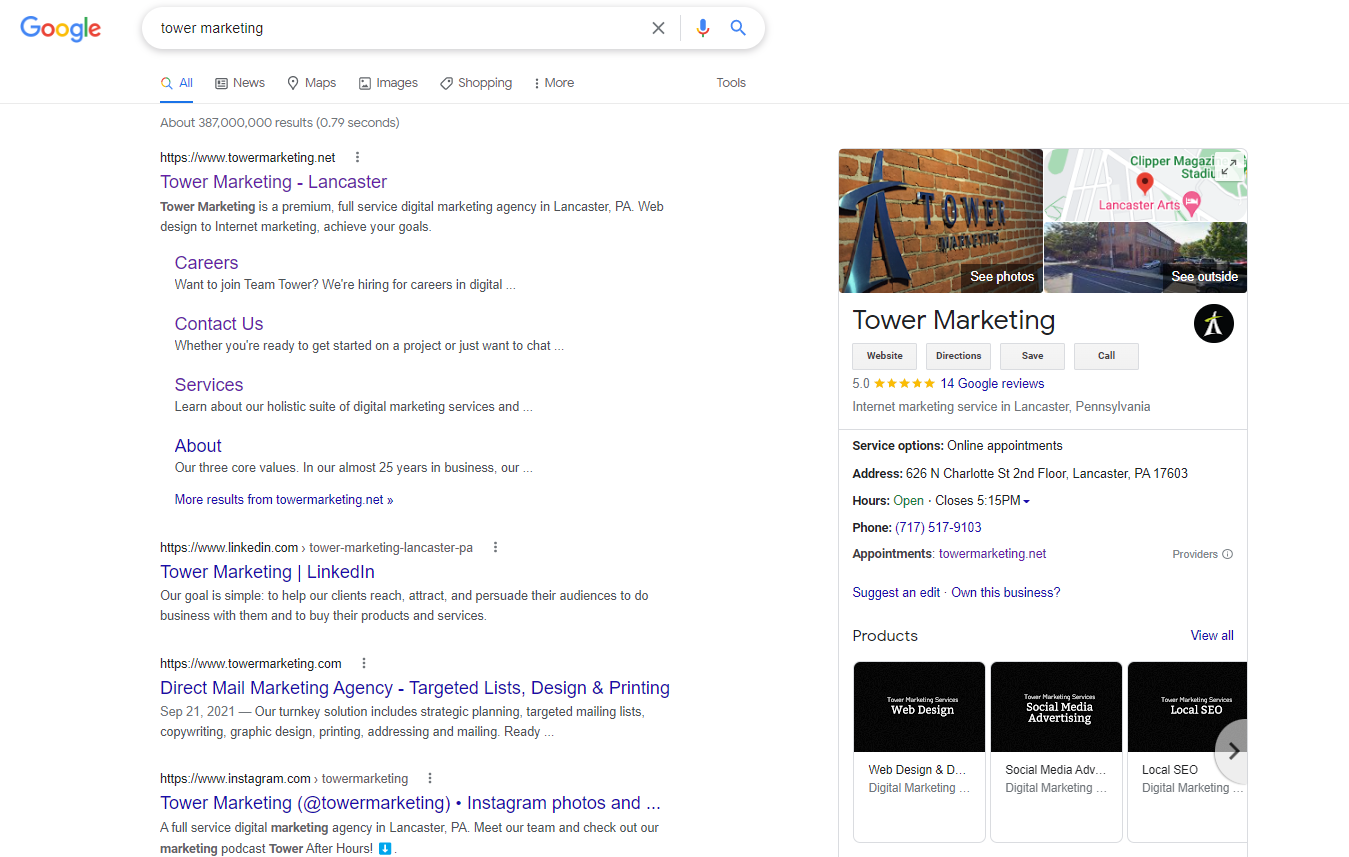
This is more of an advanced level local SEO strategy but adding local business schema is one of the best ways to tell search engines about your business besides using the Google properties.
With local business schema, you can tell Google about your business in more detail including departments, reviews, and hours to name a few of the properties you can add to the local business structured data. When you add structured data to your homepage, your business may show the prominent knowledge panel on the side of the SERPs.
Our team of SEO specialists can help your business rank well using schema. We have the knowledge and expertise to get your business ranking higher than ever on Google Maps.
#4) User Reviews
Reviews act as an immediate indicator to users. A business with consistently low reviews and ratings is not considered trustworthy and as a result, can lose a lot of business. Positive reviews encourage users to at least visit your site because it is easier for a user to trust other users, rather than a business that over-promises.
When it comes to ranking on different search engines, not all business reviews carry the same weight. Encourage your audience to leave reviews on sites that will have the biggest impact on your search rankings.
#5) Backlinks
As with organic SEO, external backlinks have been a key part of the local SEO ranking algorithm. Backlinks essentially work as a “points” system for search engines. The more “points” or backlinks your site has, the more search engines see your site as trustworthy. This is also one of the most easily measured local SEO metrics. You can monitor your backlinks through a variety of different platforms to gauge your success.
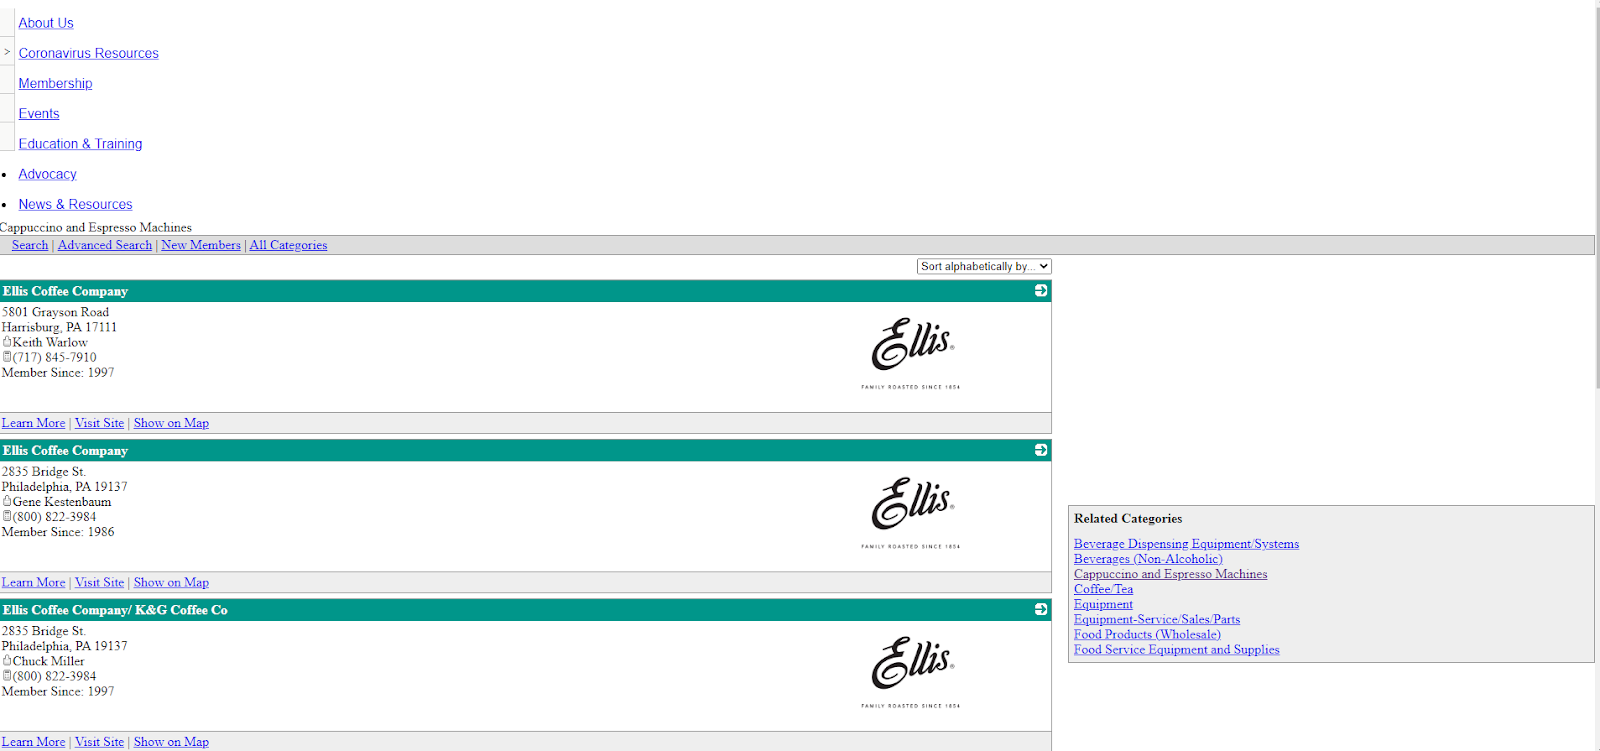
Some of these “points” will have higher domain authority than others. For example, having an external backlink from a local directory such as a visitor center or a statewide tourism site will most likely have a higher domain authority than a website that your site is on that looks spammy such as the one below.
To learn more about which local SEO directories you should add your business to, check out our guide on the top free & paid local directories now.
#6) Internal Links
Another local SEO ranking factor regarding links is your internal links. Like backlinks, internally linking has been a tried and true ranking factor for SEO. Site architecture and linking to the pages you are trying to gain local visibility to, through other methods such as blogs, is a great way to show search engines what pages you want to rank high for.
For example, if you are a business with multiple locations, having in your main navigation bar a “locations” drop-down with each of your store locations in it is one of the best ways to tell search engines this page is important for your local business opportunities.
#7) Behavioral
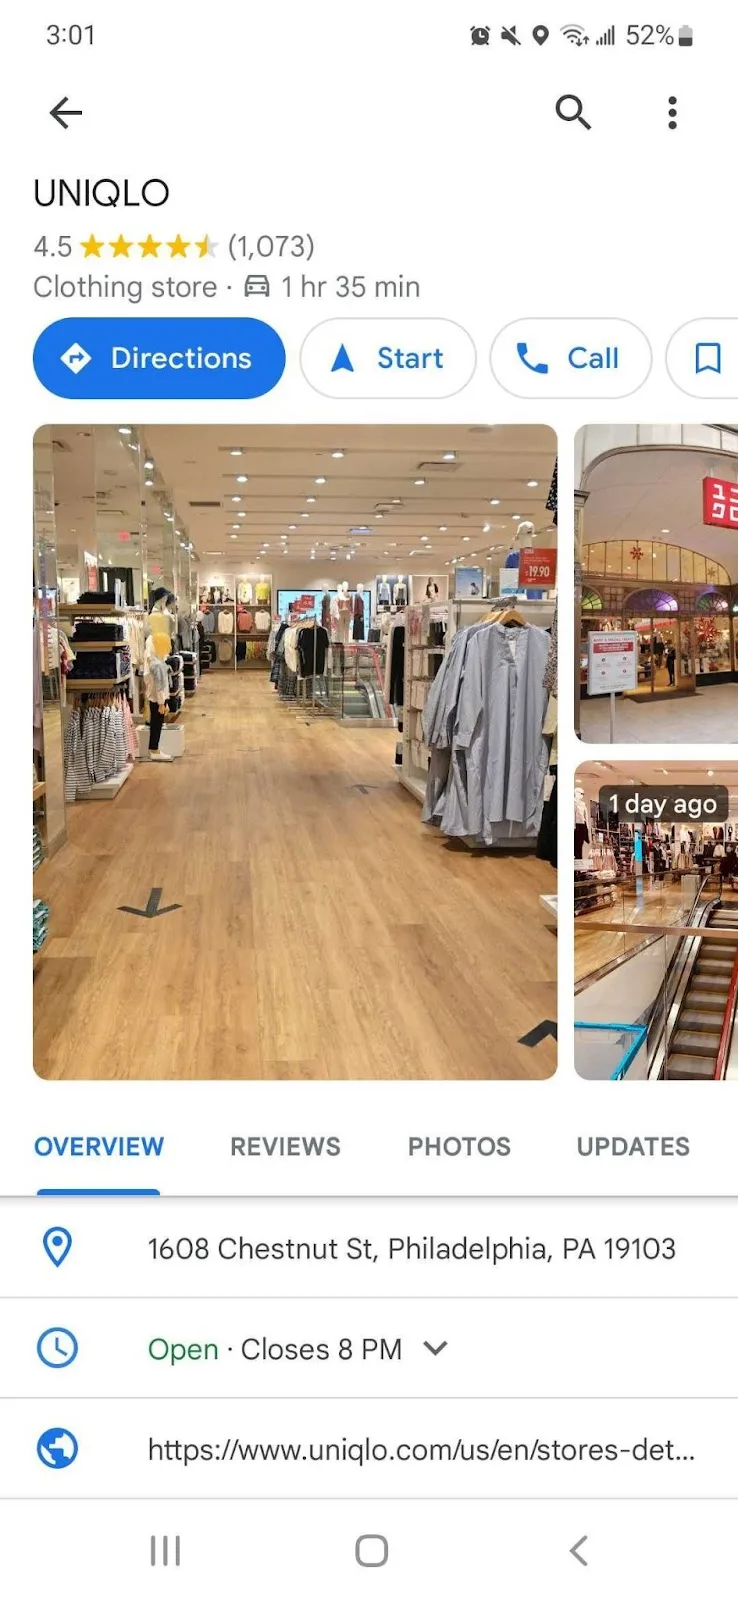
The last main local SEO ranking factor for 2022 that we are going to focus on is user behavior. For these user behaviors, we’re going to focus on actions the user can take directly on your Google Business Profile. While Google has never said directly that clicks and click-through rates are a part of SEO ranking factors, they have hinted at it and many industry experts agree clicks are a ranking factor.
Key behavioral actions users can take on your Google Business Profile.
The behavioral actions a mobile user can take on your Google Business Profile.
Directions. This includes how many people request directions to your business regardless of if they arrived at your business from their destination.
Website Clicks. This is clicking on the URL you have provided on the “website URL” feature.
Clicks to Call. Very similar to the directions behavior, this is how many people click on the call button.
Click Through Rate to your profile. While Google knows this about your business, you may not know how many people actually click on your business profile.
Local SEO can be very daunting but it also is one of the most accessible parts of the search engine optimization ecosystem. But when you fully understand what goes into ranking well on the SERPs, you’ll reap the many benefits of local SEO for your businesses.
Creating a comprehensive and cohesive SEO strategy for your business takes a team of experts to pull off. Our experts are skilled in boosting your search results, not just through local SEO, but through all aspects of SEO.
This blog was originally published on September 25th, 2017. It was updated on October 18, 2022
Whether you work with a digital marketing agency or an in-house marketing team, you’ve probably received reports that have a lot of information you don’t fully understand.
In this blog, we’ll explore the key performance indicators (KPIs) you should pay attention to, regardless of your industry. We’ll also review how you can analyze your digital marketing performance metrics and explain what your spend is going towards.
What Are Internet Marketing Metrics?
There are two buzzwords you’ll hear when talking about digital marketing: analytics and data.
Not sure what these terms mean in the context of Internet marketing? Simply put, analytics help us see the data that’s being processed to provide us with the valuable performance metrics we use to make informed business decisions.
That raises yet another question: what are marketing metrics, and which ones should I be paying attention to?
Marketing metrics are the measurable, quantifiable insights you or your agency use to measure the success of campaigns and projects. They’re the most important indicators you should pay attention to because they help you determine exactly where your money is going.
We’ve established that you need data to make informed decisions. But which metrics should you pay attention to on your report?
Digital Marketing KPIs: What They Are, Why They Matter, & How to Analyze Them
While there are hundreds of metrics to consider, we’re going to review the most important digital marketing KPIs for each marketing channel. Each of these metrics are important, but you can’t draw a single conclusion without looking at the bigger picture.
Overall Digital Marketing KPIs
The KPIs below apply to every channel and are fairly universal across digital marketing.
Impressions
What It Is
Impressions are how many times your content is shown to a user.
Why It Matters
Impressions matter for many reasons. The most important reason is that they reveal how many people are seeing your content, whether it’s an ad in a PPC campaign or an Instagram post.
How to Analyze It
For a brand exposure campaign, higher impressions are great. But for a lead generation campaign, impressions may not be as important as key events.
Clicks
What Is It
Clicks are how many people click on your content.
Why It Matters
Clicks are when a user takes the action you want them to. This could be clicking on a sale link in an email, reading news from a social media post, or clicking on a video ad.
How to Analyze It
You should analyze clicks for every campaign you run online. If you see low clicks, be sure to dive into the issue. It could be a simple spelling mistake on your ad copy, or it could mean you’re targeting the wrong audience.
If you see an abundant amount of clicks on your content, make note of this and document exactly what you think is working.
Click-Through Rate (CTR)
What It Is
Click-through rate is the number of clicks divided by the number of impressions.
What It Means
You can use CTR to determine which campaigns are successful and which ones need improvement. For example, if you received 1,000 clicks on an ad that had 5,000 impressions, you would have a 20% CTR.
How to Analyze It
First things first: there is no “good” click-through rate. Every campaign, industry, and business has different benchmarks for CTRs. Google Ads campaigns have much lower click-through rates than Instagram ads, but this doesn’t mean one is working better than the other.
If you see a dip or increase in your CTR, always question it within the bigger picture. Was there a change in the wording on a button? Was there an engaging picture?
Engagement Rate
What It Is
According to Hootsuite, “engagement rate is a formula that measures the amount of interaction social content earns relative to reach or other audience figures. This can include reactions, likes, comments, shares, saves, direct messages, mentions, click-throughs, and more (depending on the social network).”
Engagement rate can be a critical deciding factor when allocating more marketing spend. If you see that videos are driving traffic to your site and experiencing a long retention period, you should consider spending more on videos. The same goes for a low engagement rate. If you see that videos are not performing well, you may decide to reduce your video budget.
Conversions (Now called Key Events)
What It Is
Key events are actions that users complete on your site.
What It Means
If you’re a service-based company, one key event is lead generation. On the other hand, an eCommerce website’s key event could be purchasing a product. Simply put, a key event is a final action a user completes on your site.
How to Analyze It
In most cases, key events mean nothing without a business goal. If you find you’re exceeding or underperforming your key event goals, it may be time to:
Reevaluate your objectives.
Ask your marketing agency what they’re seeing on their end
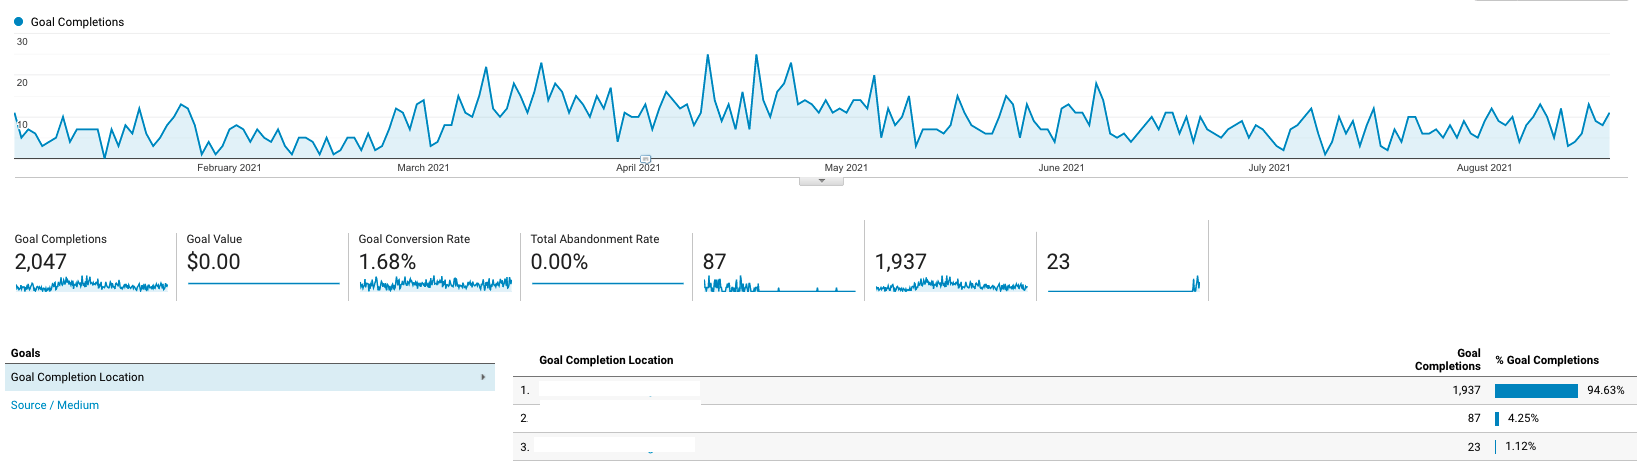
Key Event Rate
What It Is
Key event rates are the percentage of website visitors that complete a key event. This is calculated simply by taking the number of key events divided by users, or impressions.
What It Means
Key event rate should be one of the first metrics you look at when checking your reports. This is because it’s a simple way to determine if your digital marketing is working or not.
How to Analyze It
A high key event rate can indicate a successful campaign, and a low key event rate signals something isn’t quite working.
Cost Per Key Event
What It Is
Cost per key event is the total cost of the traffic (or impressions) by the number of key events.
What It Means
In other words, cost per key event is the actual spend it took to obtain a customer.
How to Analyze It
Cost per key event is the easiest way for you to answer, “how much did it cost me in advertising to get my customer to do action X.”
You should use cost per key event to evaluate your online advertising success. Don’t be alarmed if your cost per key event is high when you first start digital marketing. It should decrease over time, and if it doesn’t, contact your marketing agency to solve this problem.
Cost Per Acquisition (CPA)
What It Is
While cost per acquisition is often confused with cost per key event, cost per acquisition is the total cost of a campaign divided by the number of key events.
What It Means
Just like cost per key event, this is an easy way for you to examine the dollars and cents that went into your acquisitions.
For example, if your total budget was $1,000 and you received 50 key events, you paid $20 per acquisition.
How to Analyze It
Like most KPIs, there is no “good” CPA. Every online business has different factors – such as margin and prices – that make up a “good” CPA. As you analyze your CPA, ask yourself, “is the cost of acquiring the new customer worth it?”
Customer Lifetime Value
What It Is
Customer lifetime value (CLV) is a metric you can use to determine the total revenue of a customer throughout their relationship with your business.
What It Means
You can use this metric to determine how much you can expect to make from one single customer. If you own a car dealership, you might see a high CLV, as a new car will need to be serviced often. If you own a service-based business that offers a one-time setup, you can expect a lower CLV.
How to Analyze It
Analyzing your CLV can be tough, as it may remain stagnant. However, this can be a valuable opportunity for you. If you can figure out ways to improve your CLV – such as loyalty programs and offering more services – you can greatly benefit from analyzing this metric.
Email Marketing KPIs
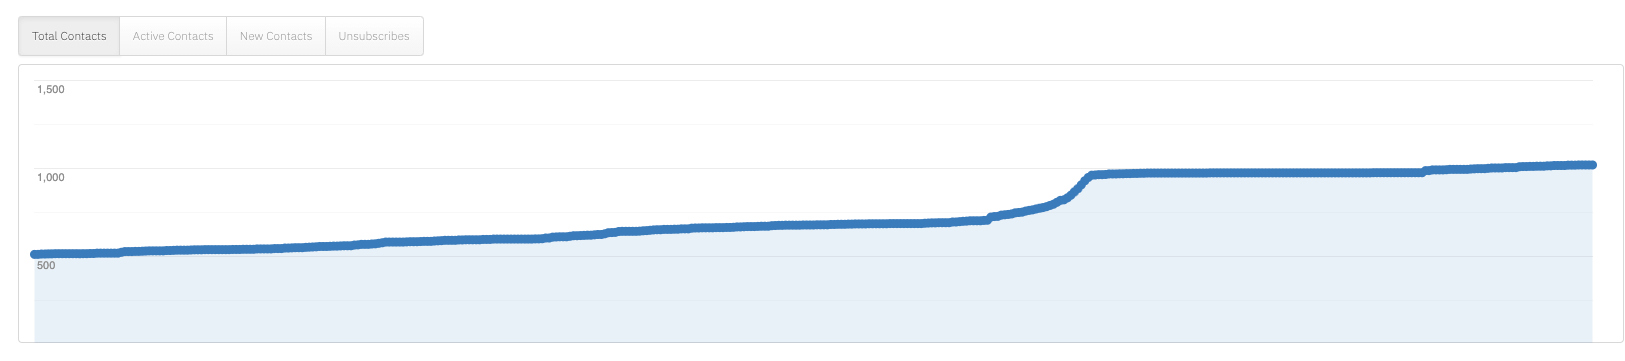
List Growth Rate
What It Is
List growth rate allows you to calculate whether your email list is growing. You can calculate the list growth rate by subtracting the number of unsubscribers from the number of new subscribers and dividing that by the number of email addresses in your list.
What It Means
List growth rate is an easy way to determine if your email list is growing or declining.
How to Analyze It
You can use list growth rate to evaluate whether you should increase or cut back on your email marketing efforts.
Click-to-Open Rate (CTOR)
What It Is
Click-to-open rate, according to Active Campaign, is the percentage of people who open an email campaign and also click on a link within that campaign.
What It Means
Looking at your CTOR is a great and simple way to measure your campaign’s effectiveness.
How to Analyze It
Analyzing CTOR is often better than measuring your open rate on your email. Open rate calculates the amount of subscribers who opened your email while CTOR also looks at those subscribers who opened the email, which ones also clicked on the links.
Looking at your click-to-open rate will give you a better idea of who is engaging with your emails the most and if they are not, should you segment that list to further hone the strategy.
Unsubscribe Rate
What It Is
Unsubscribe rate is the opposite of list growth rate, as it shows you the percentage of users who opted out of your mailing list after a campaign.
What It Means
Looking at your unsubscribe rate tells you which types of emails are working for you.
How to Analyze It
Analyzing your unsubscribe rate may be counterintuitive at first, as you may think, “my emails aren’t working” and move on. But a high unsubscribe rate may be a good thing. Everybody wants bigger email lists, but there is value in only sending emails to only the most willing and engaged recipients.
On the other hand, your unsubscribe rate may be a bad metric to look at because it may mean your emails have no value and that people on your list want out. Or, it could be a signal that you’re sending too many emails.
SEO KPIs
Backlinks
What It Is
Backlinks are links from other websites directing users to your website.
What It Means
The number of backlinks you have is important for a multitude of reasons. Essentially, backlinks act like votes for a search engine. The more backlinks your website has, the more a search engine sees you as a trustworthy site.
How to Analyze It
When analyzing the number of backlinks you have, you should look at whether the number is increasing or decreasing when compared to another period.
If your number of quality backlinks is increasing, you should continue to invest in SEO. If you see a low number of backlinks, you should probably still invest more in SEO to get “votes” for your site.
Keywords
What It Is
Keywords are specific phrases, questions, or ideas that define what your content is about.
What It Means
The number of keywords or “search queries” you have on your site is essential to a high-ranking website. The goal is to drive users to your site through your content, which should have keywords that users are searching for. The more keywords you have, the better chance you have of driving organic traffic to your website.
For example, when you Google “what is the best coffee grinder for under $100?”, the keyword is “Best Coffee Grinder For Under $100”.
How to Analyze It
When analyzing keyword queries on your report, take note of ones that are outperforming other queries on your site. This will give you a better understanding of your customers and how they got to your site.
For example, if you see an increase in traffic on your site for product X, it may be worth investing in more content explaining the benefits of that item. You could also create search ads around that product, as you know people are searching for it
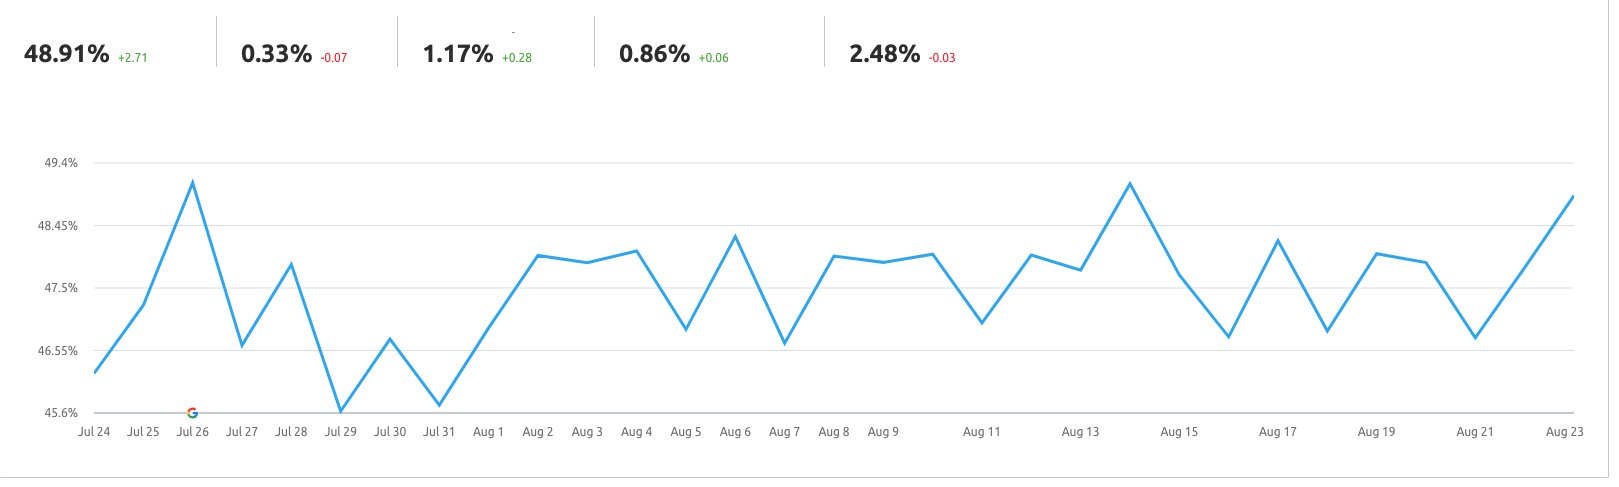
Visibility Percentage (%)
What It Is
According to SEMrush, “visibility % is based on click-through rate (CTR) that shows a website’s progress in Google’s top 100 for keywords from the current tracking campaign.” In layman’s terms, visibility percentage is how often your website is found by users.
What It Means
You can use visibility percentage to determine whether your website is being shown to users. A higher visibility percentage means you have a better chance of bringing in new users through your site.
How to Analyze It
You can use visibility percentage as a baseline metric to help you measure your overall SEO efforts. If you’re seeing a growth in visibility percentage, that means your SEO is generally performing better. On the other hand, a drop in visibility percentage may be caused by outside factors, such as algorithm changes.
Indexed Pages
What It Is
Indexed pages are specific pages on your site that a search engine contains within its database.
What It Means
It’s important to consider the number of indexed pages on your site that a search engine has in its database. Pages that have been successfully indexed can be found by users through keywords and relatable content.
It’s also important to look at your non-indexed pages, which are pages you don’t want users to find via a search engine, but still have some sort of value to you. These could be thank you pages sent to eCommerce customers after they purchase an item.
How to Analyze It
Looking at indexed pages is a quick and easy way to see if the content on your website can be found by potential customers. If you see your number of indexed pages increasing, you know more people can find your content, visit your page, and possibly convert.
Domain Authority
What It Is
According to MOZ, “Domain Authority (DA) is a search engine ranking score developed by Moz that predicts how likely a website is to rank in search engine result pages (SERPs). Domain Authority scores range from one to 100, with higher scores corresponding to greater likelihood of ranking.”
What It Means
Domain authority is an SEO KPI, but it is not a Google ranking factor. Instead, it’s an AI-based ranking developed by MOZ to predict how well your site will rank compared to your competitors.
How to Analyze It
Generally speaking, a higher Domain Authority score means your business will show up higher in search results than your competitors. Conversely, a lower Domain Authority often means you’ll be ranked lower than the competition. If you see that your DA is increasing, that means your investment in SEO is working.
How Customers Search For Your Business
What It Is
How Customers Search For Your Business is a local SEO metric found within Google My Business (GMB). This metric is actually a combination of three metrics: direct, discovery, and branded searches.
Google defines these three metrics as:
Direct. People who find your business profile by searching for your business name or address.
Discovery. People who find your business profile by searching for a category, product, or service.
Branded. Customers who find your listing by searching for a brand related to your business.
What It Means
Looking at this metric allows you to determine how people are finding your business profile on Google. If you know what users are searching for, you or your agency can optimize your content to match those trending metrics.
How to Analyze It
When analyzing this metric, be sure to look at the three metrics included in How Customers Search For Your Business. If you see that your search is lacking direct traffic, you may want to optimize your web pages to include your brand name in the page titles.
Pay Per Click (PPC) KPIs (Google Ads & Facebook)
In this section, we’ll review PPC KPIs, which include both Google Ads and Facebook. Most people do not realize that Facebook ads are technically PPC, even though it’s a social media channel.
Return on Ad Spend (ROAS)
What It Is
Return on ad spend measures the amount of revenue your business earns for each dollar you spend on PPC advertising.
What It Means
At the most basic level, ROAS measures how effectively you’re spending your advertising dollars.
How to Analyze It
When looking at ROAS, it’s important to remember that the higher the number, the better. For example, let’s say your ROAS is 10:1. This means that for every dollar you’re spending, you’re making $10.
ROAS is often confused with ROI. However, ROAS looks specifically at the campaign level, while ROI looks at the overall investment.
Social Media Marketing KPIs
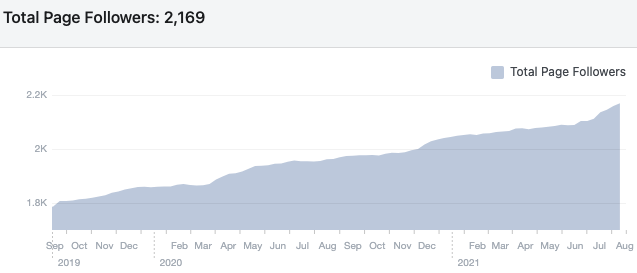
Likes/Followers
What It Is
Likes and/or followers on a social media channel are the number of people who are following your page.
What It Means
Depending on the social media platform you’re tracking, likes and/or followers are an indication of how many people are using your channels.
How to Analyze It
When looking at your follower count, you can analyze several things. Ask yourself questions like, “is it worth continuing to push our social media if we’re not seeing any engagement?,” “should I run a campaign to boost my followers?”, and “should I hire someone to optimize my campaign if I see value in it?”
It’s important to think of your social media channels as another website for your business with the goal of being a 24/7 sales tool.
Top Posts
What It Is
Top posts on your social media channels are your top-performing posts during a given period of time.
What It Means
Looking at top posts helps you determine exactly what type of content is working for you. You should consider factors like the subject, content type (images, videos, and links), the time you posted, etc.
How to Analyze It
When looking at top posts, you should be able to draw several conclusions and make decisions accordingly. If you see that all of your top posts in a given month were videos, you should probably invest more spend into videos.
How Metrics Can Be Used (and Misused)
Data-based decision-making is often at the core of digital marketing and what makes digital marketing so special. You can pinpoint where every cent you spend goes and whether it’s effective.
If you compare a traditional marketing campaign to a digital marketing one promoting the same product, there’s often ambiguity with the former. Do you know how many people saw your billboard on the side of the highway? You may have an estimate, but with digital marketing, you can measure exactly how many people saw it.
Metrics Are Often Misused
While there’s often an emphasis on metric-based decisions, it’s important to remember that, in the end, they’re just numbers and percentages. It may be a tough pill to swallow, but you may be misusing your metrics.
Let’s look at an example from two different points of view: Person A and Person B.
Let’s say you are running a Google Ads campaign that’s spending $5,000 a month to drive traffic to a particular product. Your click-through rate and impressions are higher than normal, but your key events are zero.
Person A stops the campaign completely because they spent all of that money and didn’t get a single sale.
Person B looks at the same campaign and sees an issue. The ads are working, but something on the actual product page may be broken. They determine that there’s no purchase button on the page, which led to zero key events.
This is a simple example of how metrics can be used or misinterpreted. Both people were looking at the same metric, but one saw it as an issue, while the other saw it as a signal that something else was wrong.
Collecting and analyzing your digital marketing performance metrics is only valuable if you take the time to consider what they mean to your original investment.
Common Ways That Metrics Are Misused
Collecting the wrong information. If you collect the wrong information, how can you make smart decisions based on that data? You can imagine the trickle-down effect this might have.
Looking at vanity metrics.Vanity metrics are important, but they’re not necessarily the best figures to use when making decisions. Impressions are a great example of this. You may have a ton of impressions, but if they aren’t achieving the goals you’ve set, does it really matter? This is why looking at the bigger picture is so important.
Never changing metrics. Business goals change all the time, and so should your metrics. How can you determine ROI if you’re measuring the wrong things?
Having too many metrics. There are thousands of metrics you can collect and analyze, so picking the most important ones for your business may be difficult. Choosing the wrong metrics can lead you down the wrong path.
Tips for Explaining Reports To Other Stakeholders
You’ve learned the various digital marketing performance metrics that make up each channel. Now, it’s time to learn how to explain your reports. Here are four tips to keep in mind when explaining your digital marketing reports to other people:
Explain each metric in the simplest terms possible. The key to explaining your marketing report to anyone is to explain it in Layman’s terms. The best way to explain your ROI is to put it simply. Let’s say you spent $2,000 on a PPC campaign that earned 10 key events on a product that costs $500. You may know this, but if you explain what this means to a five-year-old, you would say, “We spent $2,000 and got 10 people interested in our $500 product, meaning we potentially have $5,000 in sales. This means we’ve potentially made $3,000 on this campaign.”
Avoid vanity metrics and focus primarily on data involving investments. The truth is that not every digital marketing performance metric carries the same weight. Does a social media follower increase mean more than the average CPC on your social media campaign? Probably not. At Tower, we only include the most important metrics that our clients care about, but not every agency will do this. You’ll see every single metric available, even though you may only need to pay attention to dollar amounts. We encourage you to sit down with your agency and figure out which metrics mean the most to you.
If you have older reports to draw on, compare the numbers. If you happen to keep all of your old reports, reference them. If you don’t have them, ask your agency to pull the numbers again. How can you know what’s working and what isn’t if you don’t compare last month’s reports to the previous month or the previous year? This is one of the best ways to explain whether your investment is or isn’t working.
Look at everything together. This is ultimately what each report is for. While every digital marketing channel looks different, they’re all smaller pieces that make up the greater part of your business. Don’t just take one part of your report and look at it as a positive if there are negative aspects, too. Seeing the bigger picture is the best way to gauge the success of your digital marketing efforts.
What’s Next?
Now that you’re an expert – or at least better informed – regarding your digital marketing report, you should be able to analyze your return on your digital marketing investment.
Need help digging further into your digital marketing reporting? We do all the analysis for you so you can focus on what matters most. Work with our Internet marketing specialists to ensure you’re getting the most out of your online efforts.