 By Alex K
 How to Effectively Review User Engagement in Google Analytics 4
- Content Marketing
- PPC: Paid Advertising
- SEO
- Social Media Marketing
- UX
Join Our Newsletter List

The big countdown to GA4 is finally coming to a close, and it brings a lot of changes, which include user engagement metrics. We’ve outlined the 8 key GA4 differences you can expect, but now we’ll explore how to use the engagement metrics in Google Analytics 4 to your advantage.
Once you become familiar with user engagement in Google Analytics 4, you’ll be able to use these metrics to better define your marketing strategies and ultimately gain an extensive understanding of your audience.
What User Engagement Metrics Should You Track?
There are a lot of metrics for you in GA4, and trying to track all of them would be very overwhelming. On the other hand, if you’re not tracking the right ones, you might become more confused about what’s successful for your company and what needs work.
As you consider what metrics to track, you should align this with the purpose of your website and your company’s marketing goals. For example, if you’re looking to sell your products or services online, your KPIs are going to look slightly different than a company looking to provide thought leadership to its audience.
Below, we’ll outline some of the most influential user engagement metrics you can track to know the effect of your marketing strategies.
In appropriate sections, we’ll highlight an industry average or target range. This may vary depending on what type of industry you’re in, so you can always use Google’s benchmarking tool to find specific averages on user engagement.
Users
There are three different types of users that you should be aware of in Google Analytics 4. Each is similar but tells you a slightly different story about what your audience is doing on your website.
- New Users. In Universal Analytics, each device counted as a new user. However, GA4 will use cross-device tracking to recognize the same user on different devices.
- Total Users. Similar to what you’ve seen before, total users let you know the number of users that had an event on your website during a specific period of time.
- Active Users. Active users are a new metric you can track within Google Analytics 4. These are engaged users, or someone who stayed on the page for longer than 10 seconds, had a key event or visited more than 2 pages on your website. Ideally, a good benchmark for active users is 60% – 70% of your total users.
*Note that in Google Analytics 4, active users will be labeled as just “users”.
Why is this metric important for understanding user engagement? Increasing new users is a really great indicator that your brand awareness is growing. If you want to take this a step further, you can also see how many of these users are engaging with your website, viewing multiple pages, and spending more time on your site.
If you’re noticing that you have a lot of new users but not as many active users, it may be because your site needs some UX improvements so visitors are given a great first impression of your website.
Engaged Sessions
The engaged session metric will also be something new with Google Analytics 4. Just like with an active user, an engaged session is when someone spends more than 10 seconds on your site, viewed more than 2 pages, or completed a key event.
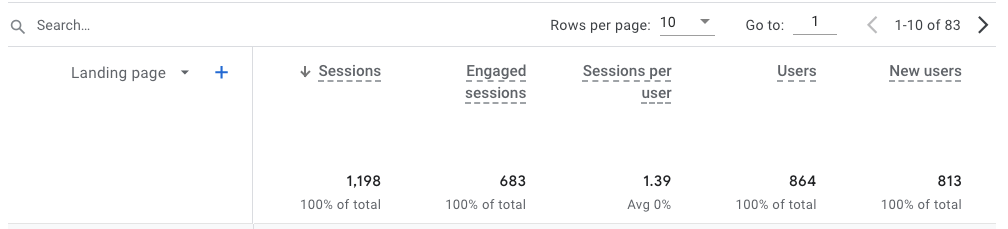
An additional, new metric in Google Analytics 4 is engaged sessions per user. This number can be found by dividing the number of engaged sessions by the number of total users. So, if you have 683 engaged sessions and 1,100 total users, your engaged sessions per user is 0.62, or 62%.
Just like your active users, a good benchmark for your engagement rate is anywhere between 60% – 70%.
Why is this metric important? What we provided above highlights your entire website’s engagement. But you can also narrow this down to specific pages. By finding specific pages that have higher engaged sessions, you can continue to promote that product/service/insight on multiple platforms.
On the other hand, you can find pages that aren’t performing as well and have lower engaged sessions. This could be a great indication to rework those pages, rewrite the blog, or to better promote the page across different mediums, like social media and email blasts.
Bounce Rate
Since engaged sessions are now an engagement metric in Google Analytics 4, you can use it to get a better idea of what your bounce rate percentage is. Simply inverse the percentage of engaged sessions to get your bounce rate.
This bounce rate will tell you how many users stayed less than 10 seconds on your site. So, continuing with the example above, if the engagement rate is 62% that means that 38% of total users went to your site and then immediately left.
Average Engagement Time
This is an important metric to show you how long your active users are spending on your website. If you’re noticing that people aren’t spending a lot of time on your page, and aren’t converting, it’s likely that something needs to be adjusted.
Again, use this metric to see where users are spending the most time on your site. If you’re noticing that your blog posts, case studies, landing pages, or other online materials are getting little engagement time, try creating evergreen, engaging, and authentic content.
Events
Now the main difference you’ll see in UA vs GA4 engagement metrics is it’s now tracking events rather than goals. Ultimately, this is going to help you see a more well-rounded view of your users and their engagement.
An event now includes any activity on your website, from a form being filled out to a user viewing one of your pages. This is where it is essential to analyze what you want to know about user activity on your website.
Make sure the events you are tracking are the most important for measuring your marketing strategies. So, if you’re an eCommerce website, you probably want to be tracking when users are browsing the inventory, adding products to their carts, and eventually checking out.
If your website’s main objective is to disperse information and show yourself as an industry expert, you should be tracking events that occur on your blog posts or case study pages. Events like page scroll depth, video progress (if relevant), and clicks.
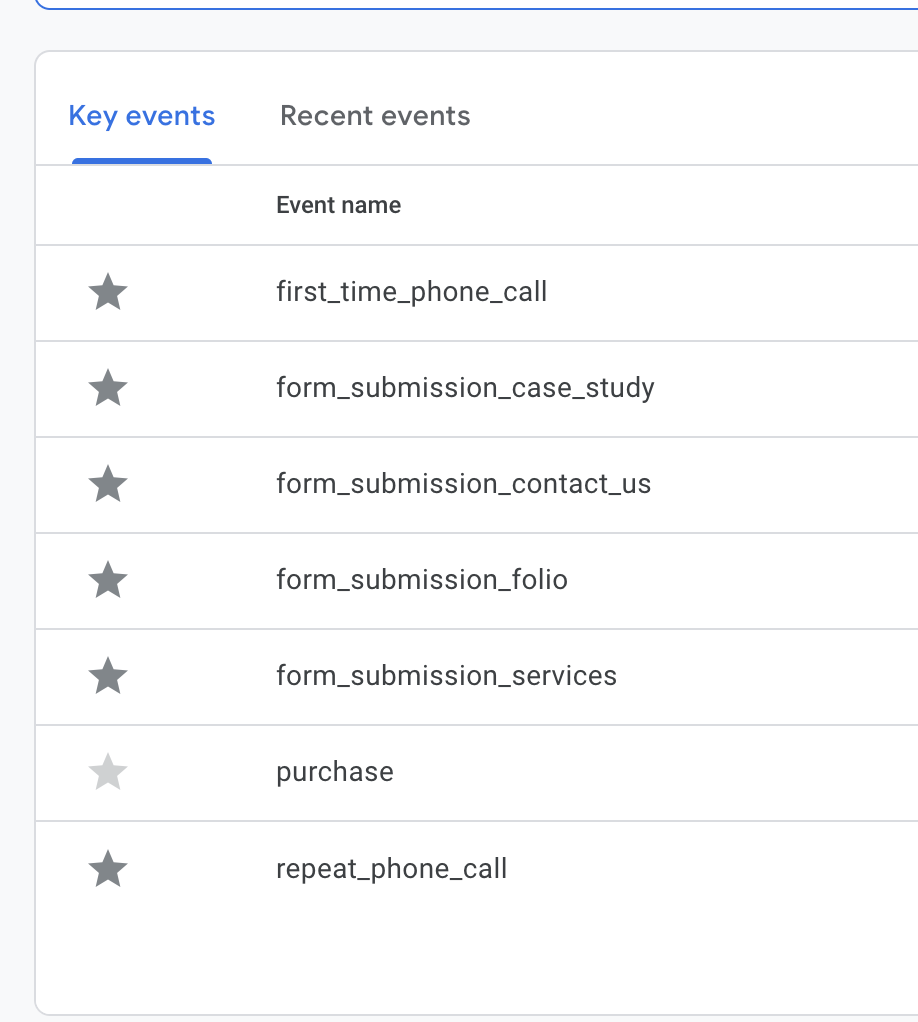
Key Events
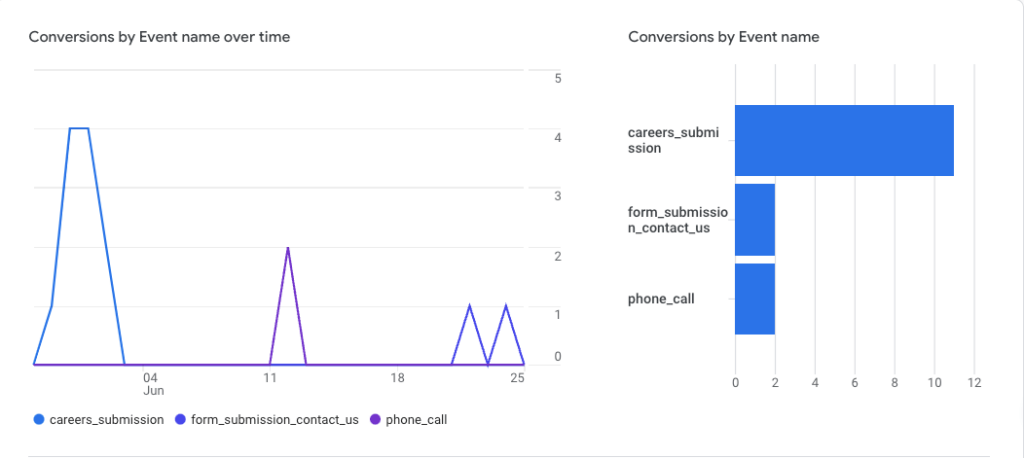
In Universal Analytics, you had to set up goals that would then track your key events. It’s going to look a bit different in Google Analytics 4. All goals have turned into events, and you can mark your most important events as key events, previously known as conversions.
Simply select the start to indicate which events you’d like to mark as key events. We recommend marking events like form submissions and phone calls as key events.
Why is this metric important? No matter the purpose of your website, you’re going to want users to take action. Key events are one of the best ways to track user engagement in Google Analytics 4.
Not only can you see specific actions being taken, but you can see where these key events are coming from. You may see key events come from an email campaign you sent out, a social advertisement, or a pay-per-click campaign.
Especially during a time when you need to reevaluate your strategies, being able to see where key events are happening can help you focus your attention on those specific channels.
How to Improve Engagement Metrics in Google Analytics
With a little time, specific tools, and website testing, you can make changes that will benefit users navigating your site.
Explore the Why
In marketing, there isn’t usually a one-size-fits-all answer as to why things are happening. Here are a few tips you can explore to gain a more accurate depiction of ways to improve your engagement metrics.
Depending on your industry, there could be multiple reasons for a decrease in engagement. If you work in an economically dependent industry, this could play a huge factor in site engagement.
There will be similar effects if your business has a seasonality factor. If that’s the case, try comparing year-over-year data rather than month-over-month, so you can get a better view of what’s happening through each season of the year.
If you are seeing dips in engagement, don’t panic! What’s important is that you’re continuing your strategies and creating engaging, evergreen content that can be used across multiple platforms to engage more of your audience.
Encourage Engagement Across Multiple Channels
It’s important to reach your audience where they are. Cross-promotions allow for your message to spread to a wider audience, nudging them to visit your site and discover your content.
You can use various internet marketing tactics like content writing, email newsletters, social media advertising, and pay-per-click advertising to capture your user’s attention and send them to your website.
Test Your Theories
As we said, there sometimes isn’t a definitive answer to why engagement is increasing or decreasing. So, it’s never a bad idea to test what you think may be the reason for the fluctuation or try implementing a new strategy.
When you’re A/B testing, make sure you’re not changing everything at once. You should only change one element at a time, so you can accurately identify the most positive effects on your user engagement in Google Analytics 4.
Need help analyzing your current strategies and pinpointing areas of improvement on your website? Contact our specialists today!
This blog was originally published on September 25, 2019, and updated on June 28, 2023.
 Trevor
 Google Analytics 4 vs Universal Analytics: 8 Key Differences Your Business Needs To Know
- eCommerce
- Marketing Strategy
- SEO
 Lauren