

Comprehensive GA4 Glossary
Looking to understand the language used around Google Analytics 4 (GA4) so you can better analyze your data? This comprehensive GA4 glossary is created to give you the foundational knowledge you need to navigate reporting.
A
These are site visitors who have an engaged session (see a definition on that below) or when GA4 gathers the first_visit or engagement_time_msec parameter parameter from tracking your site.
These are the various ways users come to your website or app. It includes channels such as Organic Search, Paid Search, Display, Email, Paid Social, Organic Social, Referral, and Direct.
These are ways that GA4 decides how to assign credit to the different touchpoints your audience interacts with along the way to converting and triggering a key event. There are three used:
- Data-driven: uses real data and machine learning to attribute credit across touchpoints.
- Linear: each touchpoint across the conversion receives equal credit.
- Time decay: more credit is attributed to the touchpoints before conversion.
- First touch model: credit goes to the first channel in the conversion journey.
Last touch model: credit goes to the last channel in the conversion journey.
These are the different paths that users are taking to complete key conversion events on your website. Depending on which attribution model you are using, the credit given to different touchpoints is distributed differently. Below is an example of an attribution path modeled with a data-driven approach in GA4.
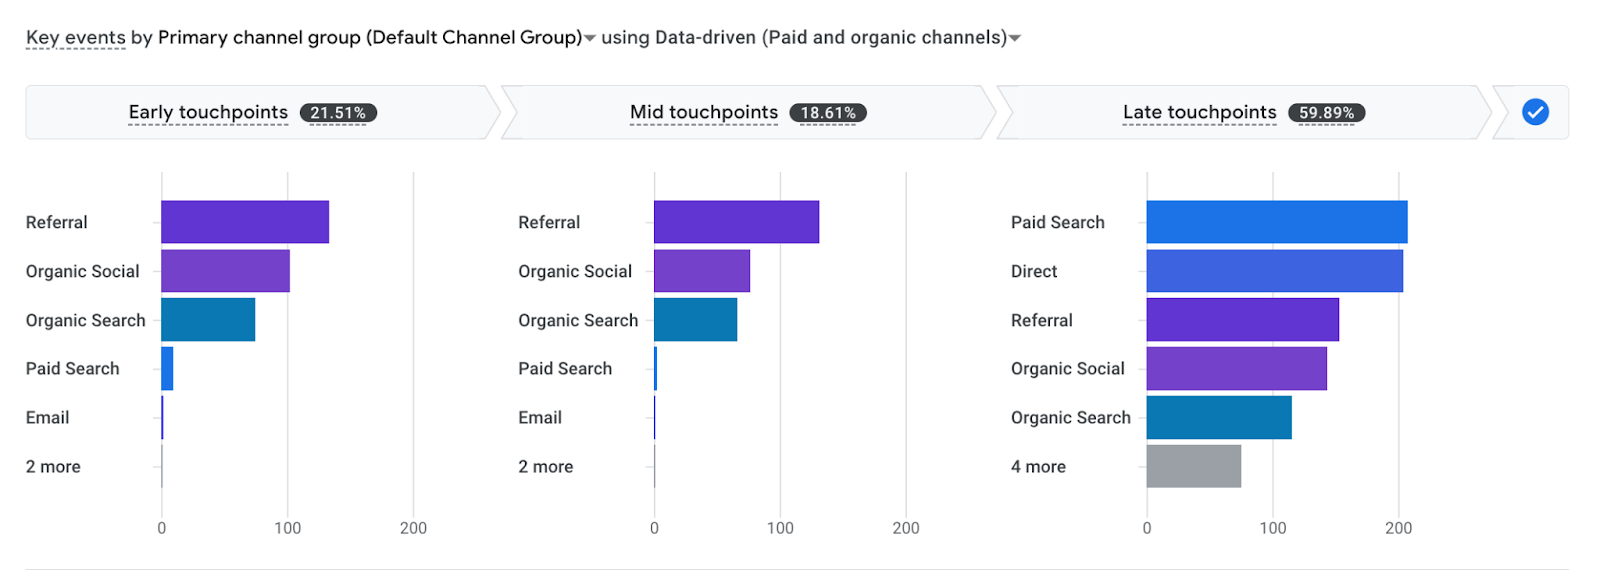
In GA4 you can see the data aggregated and placed into three touch points above, or you can get granular and see a breakdown of specific conversions. For example, the attribution paths report will show if a user interacted with different channels like PPC, email, organic, etc., and assign weighted credit to those.
This is the sum of individual users’ total engagement time divided by the number of users within your specified date range. Engagement time is measured by either the time that your website was up in a user’s browser or they had your app open in the foreground of their device.
B
This measures the percentage of single-page sessions without interaction with the page.
C
Using an analytics dimension, a cohort in GA4 is a group of web or app users who share a common characteristic. You can then explore them in a cohort exploration, which helps you better understand what types of actions groups sharing a common trait are likely to take.
Note that you can only explore data ranging from the date you set up analytics up to yesterday. If you want to be able to do a cohort exploration with real-time data you’ll need to enable BigQuery.
This feature lets you easily compare and contrast different groupings of data within your standard reports. (They’re the new version of segments, which existed in UA.) There are a lot of comparisons you can create using dimensions and dimension values.
Note that if a report you’re looking at doesn’t support a certain dimension, then a blank card will appear. (Google notes this usually happens if you’re using the Realtime report.)
GA4 measures events using a more advanced modeling method due to the event-based system. This gives it the ability to do conversion modeling. Conversion modeling uses the machine learning capabilities of GA4 to estimate the number of conversions that may have been missed.
Alongside this comes the addition of cross-device tracking. You can track how your users are converting across multiple screens, devices, and web browsers to avoid double counting.
This newer report in GA4 allows you to link your Google Ads along with the key goals you want to display to view campaign performance and analyze the activity of different channels. This feature allows you to more easily understand which channels are driving key events so you can better allocate marketing resources.
If you’re looking to collect more in-depth data, custom dimensions can help. These are helpful in instances where you want to collect information that’s not automatically set up in predefined events. In GA4, there are three types you can leverage:
- User-scoped: useful for seeing details on custom user properties beyond the standard ones included. You can set up to 25 in a standard GA4 property.
- Event-scoped: useful for gathering details captured from an event, like identifying clicked links or engagement with a video. You can set up 50 in a standard GA4 property.
- Item-scoped: useful for gathering specific information like item color or sizing when a purchase or add-to-cart event is fired, as one example. You can set up 10 in a standard GA4 property.
D
GA4 is a data collection platform that helps you track event-based information from your website and/or app(s) to help you understand what your target audience is doing. The information it collects by default is:
- Number of users
- Session statistics
- Generalized geolocation details
- Browser & device info
You can find more details about everything collected from Google.
These are a means of filtering to include or exclude the information you want to be processed in GA4. They cannot be applied to historical data and will only capture information from the time they were created and beyond. Once you add a data filter, it will permanently affect your account. Two types of data filters you can use in GA4 include:
- Developer traffic (so you can exclude your dev team)
- Internal traffic (so you can filter out your own team’s site activity)
This is how long user- and event-level data that’s collected is stored in the GA4 servers. This information includes activity associated with cookie tracking, user ID, and other advertising-identified data.
It’s possible to choose the period that data is kept in your account. In GA4 you can choose from 2 to 14 months. The maximum period that GA4 will keep Google signed-in data is 26 months. However, if you adjust your analytics data retention time frame, the Google-sign in data will follow that set timeframe.
Data streams are the flows of information from different touchpoints. For example, within your GA4 property you could set up a data stream for your website and a data stream for your app. The information collected from your stream(s) is what populates data in your reports.
E
These are the default events GA4 automatically tracks when a property is created. These include tracking interactions such as scrolls, outbound clicks, site search, video engagement, and file downloads without requiring additional tagging.
These are sessions where users interact with your site in meaningful ways as opposed to exiting right away. An engaged session is counted when a user visits your website or app for more than 10 seconds, completes at minimum two pageviews, or completes a key event.
In GA4, the engagement rate is defined differently compared to Universal Analytics. It now measures the percentage of engaged sessions. This makes it helpful for identifying pages with low engagement rates that need improving.
GA4 is an event-based platform compared to Universal Analytics which was hit based. (So in this iteration, what people do on your site/app is more important than just measuring data based on them reaching it.) Events are the specific interactions someone can take or trigger while on your website or app. Some standard events included are:
- Page loads
- Scroll page
- Link clicks
- Completed purchases
- First visit
- Form submit (which also could be also be marked as a ‘key event’)
In addition to event tracking, some parameters allow you to see additional pieces of data from each event. These are typically created in Google Tag Manager and are attached to events with custom dimensions.
This allows you to see what pages on your site people are exiting from. Looking at this can give you insight into whether you’re creating the right experience or not for your visitors.
These are advanced insight features that give more niche insights and let you explore details about users. Explorations you can use include:
- free form: explore data in different visualizations like bar charts, pie charts, line charts, scatter plots, and more.
- funnel exploration: see what steps users are taking to complete key tasks and then use that information to optimize different audiences.
- path exploration: map out the paths users are taking and see how they’re moving (and not moving) through your website.
- segment overlap: look at how user segments overlap and relate. This may help you discover new, more detailed segments you can set up.
- user explorer: dig into the users that make up segments you’ve set up or imported and look at individual user actions.
- cohort exploration: use common attributes to group your users and analyze their behavioral data.
user lifetime: look at the behavior and value of users while they’re customers.
F
This is fired when a user comes to your site and doesn’t have a cookie from visiting your site previously. The event (first_user) can help you measure and track the number of new incoming users in your determined time frame.
I
These are automatic notifications you can get on the insights dashboard. They’re automatically populated based on artificial intelligence and are triggered when atypical trends or changes occur.
K
Key events (formally known as conversions) are the important actions users can take on your site that you value more than other events. For example, a form submission would be a key event whereas a first visit would be better assessed as a regular event. You can mark key events apart from regular events in your GA4 settings.
Conversion rate (known as key event rate) is the percentage of users who complete a desired goal (key event) out of the total number of users. This metric is essential for evaluating the success of marketing campaigns and user journeys.
L
These are any sessions that don’t meet the criteria to be considered ‘engaged.’
N
This tracks anyone who has never visited your website or app before within the time frame you’re looking at. This is tracked by GA4 using the first_visit event (Androids / websites) or the first_open event (IOS apps).
P
The purchase event is a specific event tracked by Google Analytics 4 that is automatically set up when an account or property is created. It measures online purchases or sales whether or not your business has actual products to sell. It is a subset of enhanced measurements.
R
This shows what is happening on your website or app for the last 30 minutes. It allows you to identify the number of users, where they’re coming from, what audience they’re in, what pages they’re visiting, what events they’re triggering, and which user property they’re a part of.
This is how GA4 can consolidate a user into one cross-device journey. For example, if someone visits your site on their phone in the morning and then comes back later on their tablet, they’re not being double-counted. You can find more in-depth information on reporting identity here.
These are users who have previously used your website or app within the timeframe that you’re examining.
This calculates the amount of revenue brought in by your products or services online via your eCommerce system. There are three distinct categories of revenue in GA4.
Total Revenue:
The total amount of money earned from all transactions on your site or app, including purchases, subscriptions, and other revenue sources minus any refunds given.
Purchase Revenue:
The amount of money earned specifically from user purchases of products or services on your site or app.
Item Revenue:Item revenue shows only the total revenue from items only minus tax and shipping. It is calculated as price x quantity.
S
A segment is a subset (or portion) of data you can analyze. Instead of analyzing data from all users, you might want to compare how overall user traffic compares to traffic coming specifically from the US or a default acquisition channel.
A session is the sum of activities and interactions that happen within a single period that a user visits. For example, a single session could include you visiting 3 pages, scrolling down, and subscribing to receive newsletter updates. Sessions are counted from the moment a user is on your website or app and leaves or reaches 30 minutes of being inactive.
T
Reports that offer insights into the technology users use to access your site or app, including details on device type, operating system, and browser.
This accounts for the number of unique visitors to your website or app, regardless of whether they had an engaged session or not. It’s typical to see you have a higher number of total users than active users when looking at a specific time range. Additionally, because all types of users are tracking differently in GA4 compared to UA, Google cautions that it’s normal to see up to a 20% discrepancy between the two systems.
U
This measures the amount of time that someone has your website or app either in focus or in the foreground. The goal of this is to see and measure how much time users spend interacting.
There are two different pieces of this that GA4 offers: session key event rate and user key event rate. This simply looks at the percentage of users who completed one or more key events and was formerly known as “user conversion rate.”
Users triggering a key event ➗ total users = user key event rate %
These are different qualifiers that depict your user base, whether that’s shared language preferences or their location.
V
In GA4, these are the total sum of website pages or app screens that users saw. This includes repeated visits by the same user. Note that GA4 counts web pages together with app screens, whereas they were previously only counting web pages in Universal Analytics. (Views here are also akin to what page views were in Universal Analytics.)
Finding This GA4 Glossary Helpful?
Get more helpful marketing resources from our team delivered directly to your inbox.
Mailing List

Ready To Rise Above?
Whether you’re looking for answers to your marketing questions or want a project quote, our content marketing specialists are happy to talk.