

I’m a visual person; so when first introduced to Google Analytic’s Behavioral Flow report, I was over my data-driven moon.
What exactly IS the Behavioral Flow Report and where can you find it? And what is the importance in analyzing Behavioral Flow? Glad you asked.
The Behavioral Flow Report allows analytics gurus (that’s you and me) to see a) how users enter and flow through your site and b) what pages are seeing the greatest drop-offs, or number of users leaving the site.
How To Find Your Behavioral Flow Report:
Step #1: Log in to your Google Analytics Account
Step #2: On the left-hand side of your screen, find the “Behavior” field; click to view the drop down menu
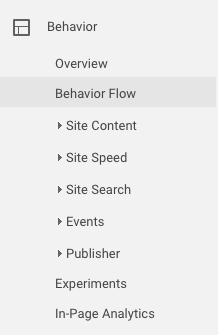
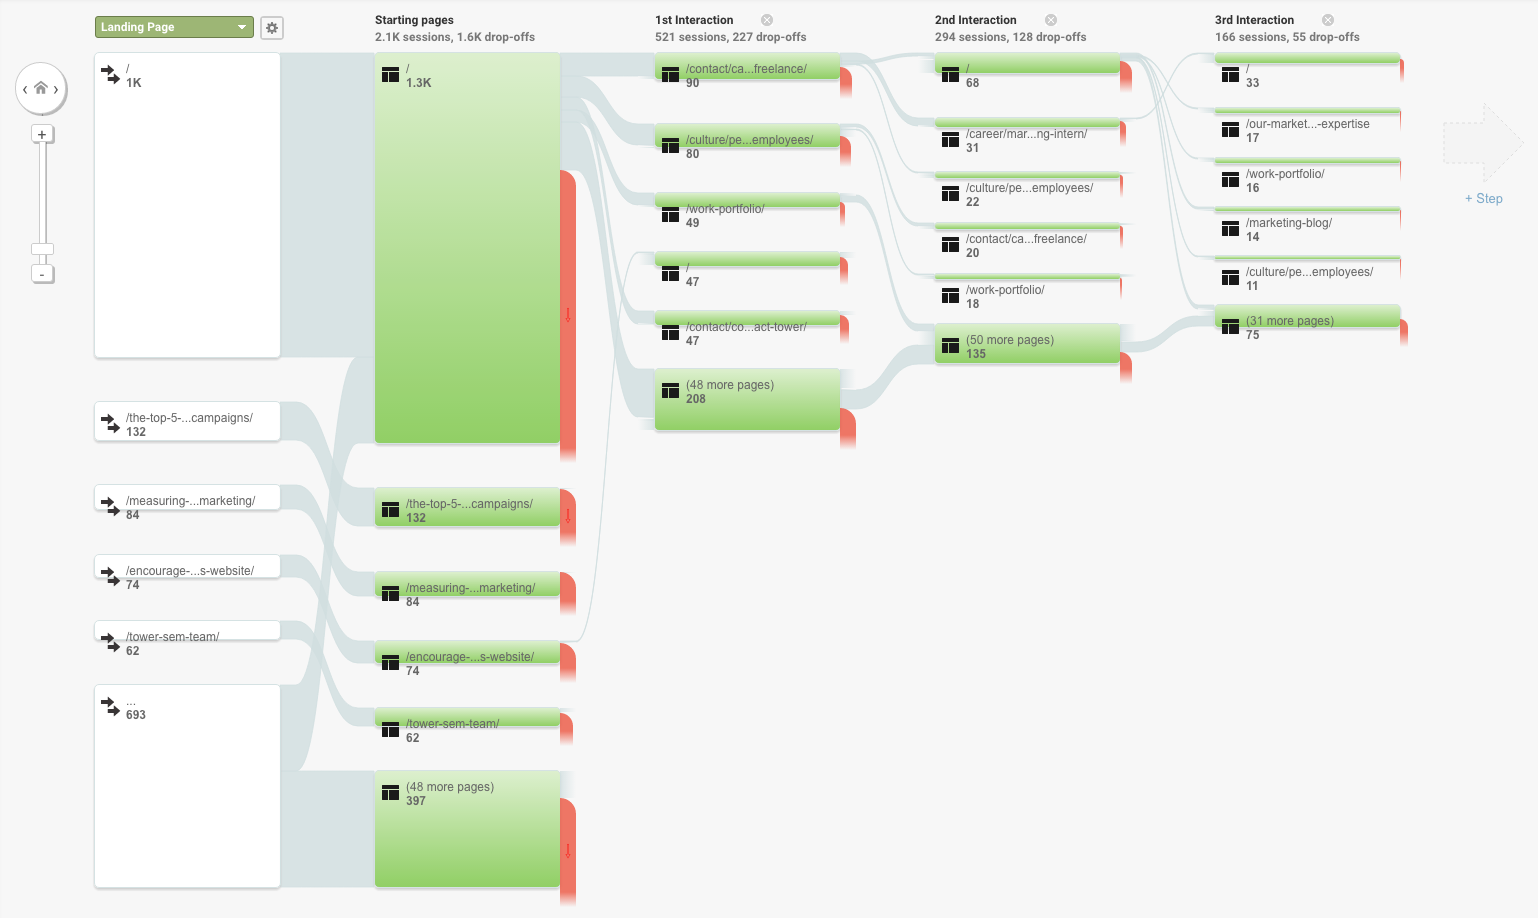
Step #3: Select “Behavioral Flow Report.” You should end up with something like this:
You are able to change the traffic source you want to view or even specific variables such as user type in the upper lefthand corner under “Source / Medium.”

From this view, you are able to see, holistically, how a user might engage with certain pages and move throughout your site.
So what’s the importance? How should we analyze the Behavioral Flow report?
I’m going to walk you through three theoretical scenarios to explore how one can utilize and analyze behavior flow for themselves!
Scenario 1:
At the beginning of the summer, Jan launched a blog for her flower shop’s site. She sees that thanks to her keyword driven content, people are landing on her blog. She has tracking set up to see whether the blogs are leading to any conversions, but notices that while some of the blogs have contributed to sales, many of the blogs have high percentages of exit and bounce rates.
How Analyzing Behavioral Flow Can Help:
Jan pulls up her Behavioral Flow report and looks specifically at traffic sources leading to the site (social vs. organic vs. referral, etc.). She sees that while many people are entering organically via the blog page, they drop off almost immediately or only go to one, max two, more pages.
However, those that come through her social channels, Pinterest in particular, seem to be the largest contributors to more page sessions and have even been the original medium that led to a conversion.
With this information, Jan knows two things:
- Her content is not performing as well as it could be organically. Jan may need to A/B test different kinds of content that will be more appealing to her website users and/or consider refocusing her keywords to ensure that her blog is relevant to search queries. She may consider adding scroll depth tracking to analyze her content more.
- Social media, Pinterest in particular, may be a hidden source of leads she had not realized was viable. She may consider Pinterest advertising to get more eyes on her posts or creating more social content to lead to her new blog pages.
Scenario 2:
Maxwell launched a new site for his small granite business six months ago. While sales for his natural granite countertops are through the roof, his synthetic granite quotes were lower than usual for the season. Maxwell sees that he’s ranking favorably for keywords he feel feels would help drive business to those pages, but wants to understand, as a whole, how this service page is performing.
How Analyzing Behavioral Flow Can Help:
Maxwell is looking at his report but notices that no traffic sources are landing on the synthetic granite page first. In fact, users aren’t getting to that page until they’re on the third or fourth page of their journey. However, those that did land on this page were almost guaranteed to lead to a quote conversion.
With this information, Maxwell knows:
The synthetic granite page is buried too deeply on his site for users to find, but, when they do find it, the page has a high conversion rate. Maxwell may consider adding this page to the navigation, designing a button to this page on the homepage, and bulking up his internal linking to have more links pointing back to this page for users to find.
Scenario 3:
Andy runs an eCommerce site selling her custom-made kites. She is currently undergoing a responsive site redesign. Andy wants to understand the differences and strengths and weaknesses of the the site on mobile versus desktop and how users interacted with certain pages.
How Analyzing Behavioral Flow Can Help:
Andy is easily able to switch between desktop and mobile users via the “Source” drop down menu in her Behavioral Flow Report. Andy notices that mobile users rarely go beyond a third page on their journey, and that the homepage has the highest percentage of drop-offs. After looking at her tracking, Andy also notices that mobile users are not converting as well as she’d like.
Desktop users, however, rarely go past a fifth page on their journey, but have high conversion rates and the homepage has only has a 48% bounce rate.
With this information, Andy knows:
Her responsive home page could use some work. Andy went with a minimalistic look for mobile, but decided that, perhaps, users were looking for more information on first arrival. Andy worked with her content team to re-boot the homepage copy and refocus their target keywords.
Andy also realized that her mobile speed may have been causing an issue and worked with her development team to ensure that they are using compressed images, that HTML was minimized and that browser caching was being leveraged appropriately.